Dow Jones Elliott Wave technical analysis [Video]
![Dow Jones Elliott Wave technical analysis [Video]](https://editorial.fxstreet.com/images/Markets/Equities/DowJones/dow-jones-industrial-average-on-iphone-19534758_XtraLarge.jpg)
DOW JONES - DJI Elliott Wave Analysis Trading Lounge.
DJI Elliott Wave technical analysis
Key details
-
Function: Counter Trend.
-
Mode: Corrective.
-
Structure: Gray wave 2.
-
Position: Orange wave 3.
-
Direction next higher degrees: Gray wave 3.
-
Details: Gray wave 1 appears complete; gray wave 2 is now active.
-
Wave cancel invalidation level: 41,608.42.
Detailed analysis
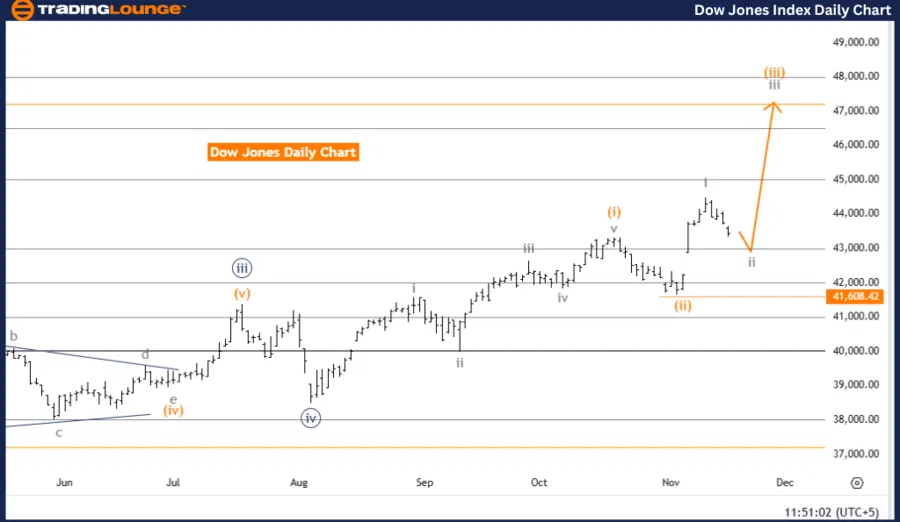
The DOW JONES daily chart from Trading Lounge identifies a counter-trend corrective phase within the Elliott Wave framework. The analysis suggests that gray wave 2 is currently active and developing as part of a larger progression toward gray wave 3. With gray wave 1 considered complete, the formation of gray wave 2 marks a temporary corrective move within the broader trend.
Corrective waves, such as gray wave 2, typically retrace a portion of the prior impulsive wave before the primary trend resumes. In this case, the activity in gray wave 2 indicates a period of pause or pullback in the market. This phase provides an opportunity for potential consolidation or correction before the anticipated advance toward gray wave 3. During this corrective phase, market fluctuations are likely as it seeks stability.
Key level for validation
The analysis identifies a critical invalidation level at 41,608.42. Should the price rise to or above this level, the current corrective structure would be invalidated, signaling a possible significant shift in market dynamics or necessitating a reevaluation of the wave count. Monitoring this threshold is vital for traders to assess the continuation or reversal of the wave structure.
Summary
The DOW JONES daily chart analysis reflects a counter-trend corrective phase, with gray wave 2 developing after the completion of gray wave 1. This phase precedes the expected development of gray wave 3, which would resume the larger trend. Traders are advised to closely watch the invalidation level at 41,608.42, as any movement above this level could challenge the current corrective wave structure. This invalidation point is crucial for confirming the validity of the corrective phase and the progression of the Elliott Wave pattern.
DJI Elliott Wave technical analysis
Key details
-
Function: Bullish Trend.
-
Mode: Impulsive.
-
Structure: Orange wave 3.
-
Position: Navy blue wave 5.
-
Direction next lower degrees: Orange wave 4.
-
Details: Orange wave 2 appears complete; orange wave 3 is now active.
-
Wave cancel invalidation level: 38,520.90.
Detailed analysis
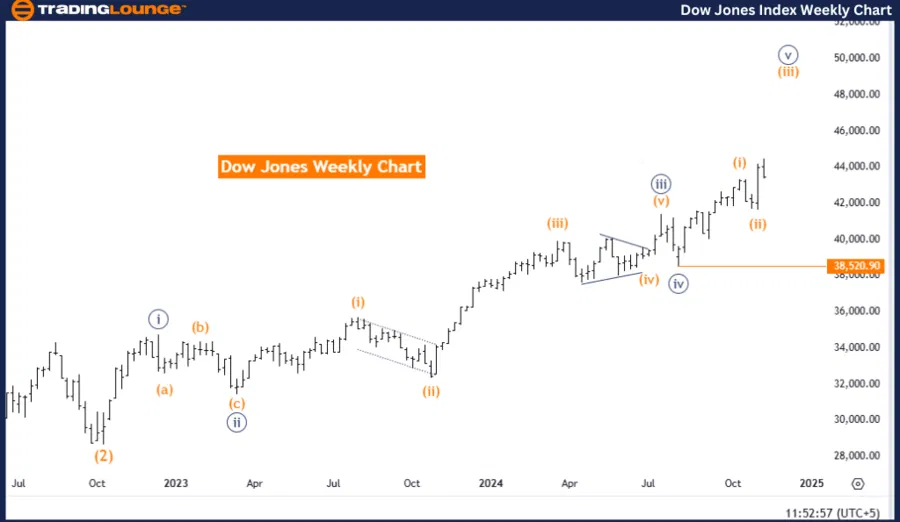
The DOW JONES weekly chart analysis from Trading Lounge reveals a bullish trend, supported by an impulsive Elliott Wave structure. The active wave, orange wave 3, is positioned within navy blue wave 5, reflecting strong upward momentum in the market. With orange wave 2 now complete, the progression of orange wave 3 marks a critical phase of the ongoing bullish cycle.
According to Elliott Wave theory, wave 3 is often the most powerful and extended wave in an impulsive pattern. It is typically characterized by sustained and significant upward movement. The development of orange wave 3 within navy blue wave 5 highlights the strength of the bullish trend, with the market positioned for further gains before transitioning into the corrective phase of orange wave 4.
Key level for validation
The analysis defines a critical invalidation level at 38,520.90. A price drop to or below this level would invalidate the current wave structure, indicating a potential weakening or reversal of the bullish trend. This threshold serves as a vital reference point for traders to confirm the integrity of the wave pattern and assess market direction.
Summary
The DOW JONES weekly chart analysis reflects a bullish trend, with orange wave 3 driving the market upward as part of navy blue wave 5. The completion of orange wave 2 signals the beginning of a robust upward phase, with additional growth anticipated before entering the orange wave 4 corrective phase. Traders should closely monitor the invalidation level at 38,520.90, as a breach below this point could challenge the current bullish outlook and necessitate a reevaluation of the Elliott Wave structure. This level is critical for confirming the continuation of the upward trend and the accuracy of the analysis for the DOW JONES index.
Dow Jones Elliott Wave technical analysis [Video]
Author

Peter Mathers
TradingLounge
Peter Mathers started actively trading in 1982. He began his career at Hoei and Shoin, a Japanese futures trading company.


