Dow Jones – DJI Elliott Wave technical analysis [Video]
![Dow Jones – DJI Elliott Wave technical analysis [Video]](https://editorial.fxsstatic.com/images/i/Equity-Index_DJI-2_XtraLarge.jpg)
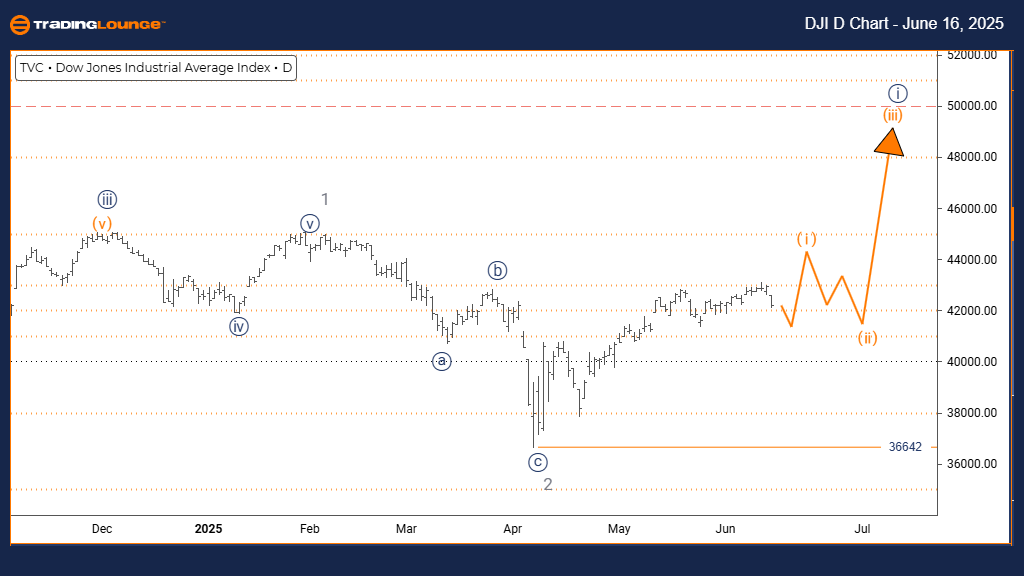
DJI Elliott Wave technical analysis – Day chart
Function: Bullish Trend.
Mode: Impulsive.
Structure: Orange Wave 1.
Position: Navy Blue Wave 1.
Direction next lower degrees: Orange Wave 2.
Details: Gray Wave 2 appears completed. Currently, Orange Wave 1 of Navy Blue Wave 1 is active.
Wave cancel invalidation level: 36642.
The DOW JONES - DJI daily chart indicates a bullish trend. The current price movement is showing impulsive characteristics, reflecting strong upward momentum. This wave setup is labeled as Orange Wave 1, which falls under a larger structural pattern—Navy Blue Wave 1. This alignment implies that the index has entered the initial phase of a potentially extended upward cycle.
Evidence suggests that Gray Wave 2 has ended its corrective behavior. As a result, Orange Wave 1 of Navy Blue Wave 1 has now begun, signaling the start of a notable upward move. The next wave development expected at a lower level is Orange Wave 2, which would typically act as a corrective pullback after the completion of Orange Wave 1, before the bullish trend continues.
A key support level is the wave invalidation point at 36642. If the index falls below this mark, the current Elliott Wave count would become invalid, necessitating a reassessment of the bullish projection. Unless this level is breached, the current wave outlook supports continued upward momentum.
The technical formation presently supports a scenario of continued bullish price action within Navy Blue Wave 1, with Orange Wave 1 active. The confirmed completion of Gray Wave 2 reinforces this trend. The impulsive nature of the market supports a case for sustained buying activity and further price gains in upcoming sessions.
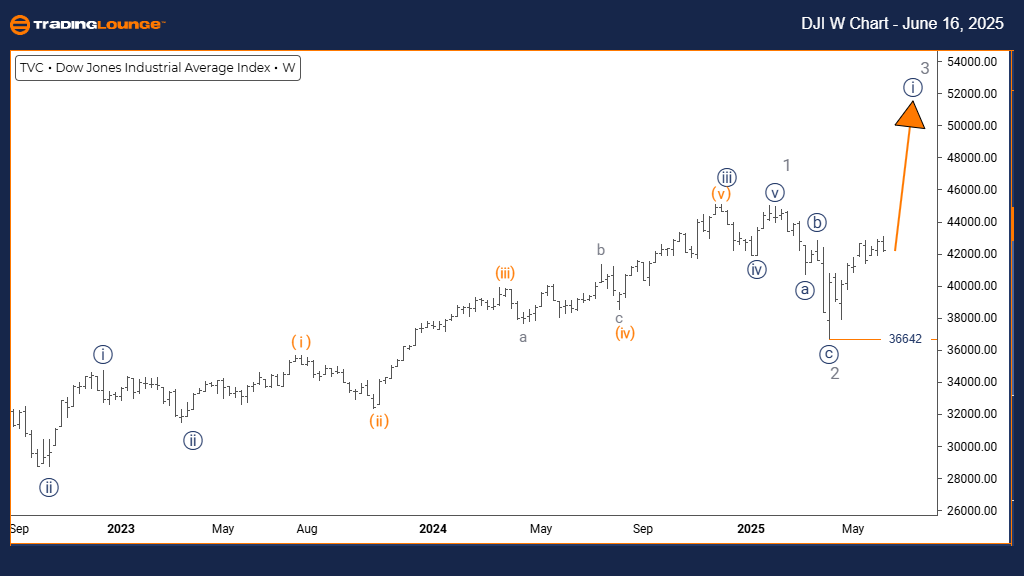
DJI Elliott Wave technical analysis – Weekly chart
Function: Bullish Trend.
Mode: Impulsive.
Structure: Navy Blue Wave 1.
Position: Gray Wave 3.
Direction next lower degrees: Navy Blue Wave 2.
Details: Gray Wave 2 appears completed. Currently, Navy Blue Wave 1 of Gray Wave 3 is active.
Wave cancel invalidation level: 36642.
The weekly Elliott Wave analysis of the DOW JONES - DJI shows a bullish trend, with price action currently in an impulsive mode, reflecting strong upward movement. The wave structure is labeled as Navy Blue Wave 1, part of a broader wave formation — Gray Wave 3. This indicates the index is likely at the early phase of a larger upward movement.
Analysis reveals that Gray Wave 2 has finished its corrective stage, marking the start of Navy Blue Wave 1 within Gray Wave 3. This suggests the possibility of a substantial impulsive rise. The expected next development at a lower degree is Navy Blue Wave 2, which would usually act as a corrective retracement following the completion of Navy Blue Wave 1, before the uptrend resumes.
It is important to keep an eye on the wave cancellation level of 36642. If the price dips below this level, the current wave count would no longer be valid, prompting a reassessment of the bullish setup. As long as the price remains above this level, the bullish trend remains intact.
The chart suggests a strong potential for continued upward movement under Gray Wave 3, with Navy Blue Wave 1 currently active. The confirmed completion of Gray Wave 2 reinforces this positive outlook. The impulsive structure supports further upward momentum, reflecting sustained buying interest and the likelihood of additional gains.
DJI Elliott Wave technical analysis [Video]
Author

Peter Mathers
TradingLounge
Peter Mathers started actively trading in 1982. He began his career at Hoei and Shoin, a Japanese futures trading company.


