Dow Jones (DJI) Elliott Wave technical analysis [Video]
![Dow Jones (DJI) Elliott Wave technical analysis [Video]](https://editorial.fxsstatic.com/images/i/Equity-Index_DJI-1.jpg)
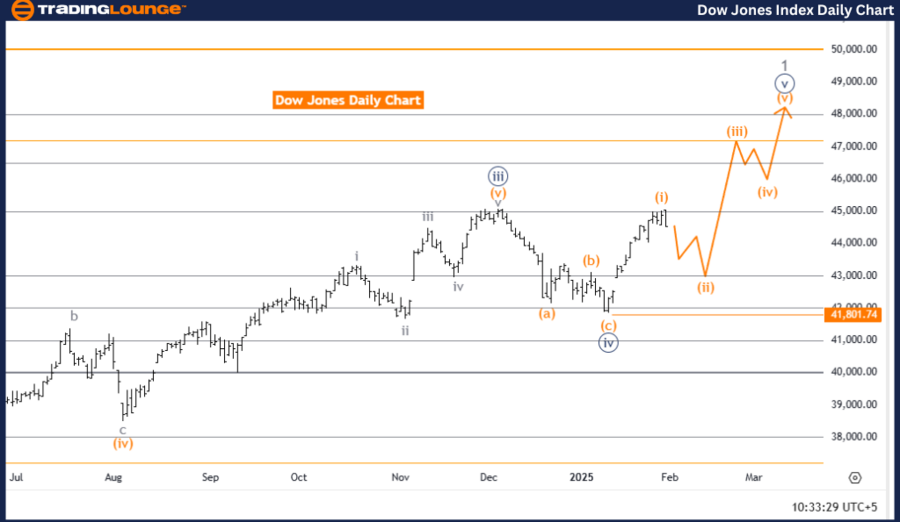
Dow Jones (DJI) Elliott Wave Analysis – Trading Lounge Day Chart
Dow Jones (DJI) Elliott Wave technical analysis
-
Function: Counter Trend.
-
Mode: Impulsive.
-
Structure: Orange wave 2.
-
Position: Navy blue wave 5.
-
Next higher degree direction: Orange wave 3.
-
Details: Orange wave 1 appears to have completed, and orange wave 2 is now in progress.
-
Wave cancellation invalidation level: 41822.74.
Analysis overview
This Elliott Wave analysis of the Dow Jones Industrial Average (DJI) daily chart highlights a counter-trend movement within an impulsive wave structure. The primary focus is on orange wave 2, which began following the completion of orange wave 1. This phase represents a corrective pullback within the broader market trend.
Currently, the market is in navy blue wave 5, marking the final stage of this wave cycle. The transition from orange wave 1 to orange wave 2 suggests a temporary retracement within the bullish market structure. Traders should closely monitor orange wave 2, as it plays a crucial role in setting the stage for orange wave 3, which is expected to resume the upward momentum.
Future market outlook
The wave cancellation invalidation level is set at 41822.74. A price movement above this level would invalidate the current wave count, requiring a reassessment of the market outlook.
Conclusion
In summary, this daily chart analysis for the Dow Jones Industrial Average (DJI) outlines a corrective counter-trend phase, represented by orange wave 2 within navy blue wave 5. The completion of orange wave 1 signifies the beginning of this corrective movement.
The anticipated transition to orange wave 3 suggests a potential return to bullish momentum once this correction concludes. Traders should remain alert to key developments and use the wave cancel invalidation level as a guide for validating or adjusting their market strategies. This analysis provides valuable insights for navigating the current market pullback while preparing for potential future upward movements.
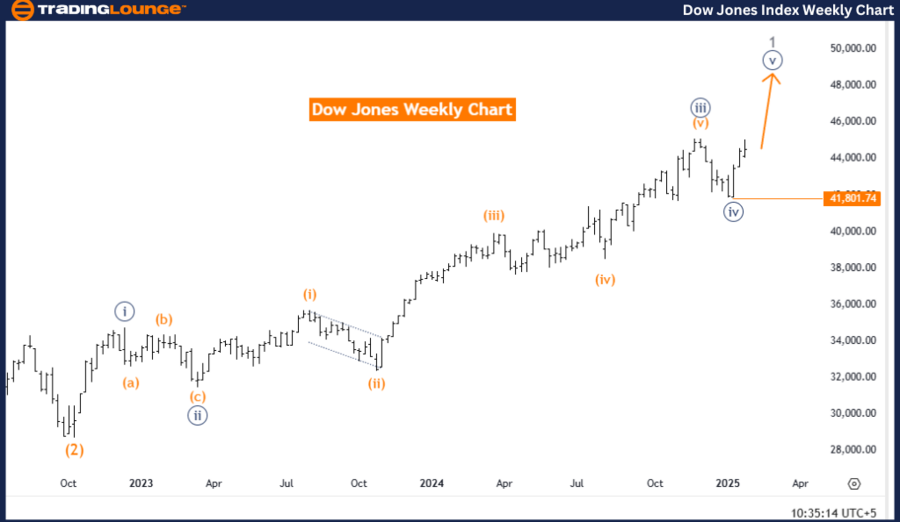
Dow Jones (DJI) Elliott Wave analysis – Trading Lounge weekly chart.
Dow Jones (DJI) Elliott Wave technical analysis
-
Function: Bullish Trend.
-
Mode: Impulsive.
-
Structure: Navy blue wave 5.
-
Position: Gray wave 1.
-
Next higher degree direction: Navy blue wave 5 (started).
-
Details: Navy blue wave 4 appears to have completed, and navy blue wave 5 is now in progress.
-
Wave cancellation invalidation level: 41822.74.
Analysis overview
This Elliott Wave analysis of the Dow Jones Industrial Average (DJI) weekly chart indicates a bullish trend within an impulsive wave structure. The primary focus is on navy blue wave 5, which began following the completion of navy blue wave 4. This progression suggests continued upward momentum as the market advances through the final impulsive wave.
Currently, the market is positioned in gray wave 1, marking the early stage of a new bullish sequence. The transition from navy blue wave 4 to navy blue wave 5 confirms the market's readiness to resume its upward trajectory. The ongoing movement within navy blue wave 5 is expected to dominate market activity, reinforcing sustained bullish pressure.
Future market outlook
The wave cancellation invalidation level is set at 41822.74. If the price moves above this level, the current wave count would be invalidated, necessitating a reassessment of the market outlook.
Conclusion
In summary, this weekly chart analysis for the Dow Jones Industrial Average (DJI) highlights the continuation of a bullish trend, driven by the development of navy blue wave 5. The completion of navy blue wave 4 marks the beginning of this impulsive phase, reinforcing upward market momentum.
The market’s position in gray wave 1 signifies the beginning of this bullish sequence. Traders should monitor key price movements and use the wave cancellation invalidation level as a critical reference point for validating or adjusting their trading strategies. This analysis provides essential insights for navigating the ongoing bullish phase and preparing for future market developments.
Dow Jones (DJI) Elliott Wave technical analysis [Video]
Author

Peter Mathers
TradingLounge
Peter Mathers started actively trading in 1982. He began his career at Hoei and Shoin, a Japanese futures trading company.


