DJI Elliott Wave technical analysis [Video]
![DJI Elliott Wave technical analysis [Video]](https://editorial.fxsstatic.com/images/i/General-Stocks_1_XtraLarge.png)
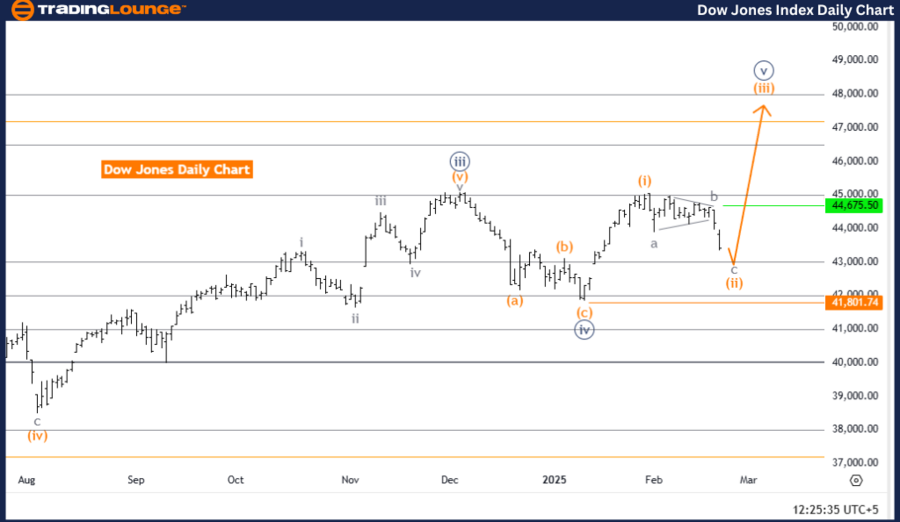
DOW JONES (DJI) Elliott Wave Analysis – Trading Lounge Day Chart.
DOW JONES (DJI) Elliott Wave technical analysis
-
Function: Counter Trend.
-
Mode: Corrective.
-
Structure: Orange Wave 2.
-
Position: Navy Blue Wave 5.
-
Direction next higher degrees: Orange Wave 3.
-
Wave cancel invalid level: 41801.74.
Analysis details:
The DOW JONES Industrial Average (DJI) Elliott Wave Analysis for the day chart highlights a counter-trend scenario, indicating a corrective mode within the market structure.
The current analysis identifies that the market is in Orange Wave 2, which forms part of a larger corrective pattern. This wave is positioned within Navy Blue Wave 5, suggesting an intermediate corrective phase before the broader trend resumes. The next higher-degree movement anticipated is Orange Wave 3, expected to follow the completion of this corrective phase.
The analysis suggests that Orange Wave 1 has concluded, and the market is now transitioning into Orange Wave 2. This wave is expected to exhibit corrective characteristics, meaning it may involve sideways or downward movements before the next impulsive wave (Orange Wave 3) begins.
The completion of Orange Wave 2 will be a critical point for traders, as it will signal the potential start of Orange Wave 3, which is expected to drive the market in the direction of the larger trend.
A key level to monitor is the Wave Cancellation Invalid Level at 41801.74. If the price moves above this level, it will invalidate the current wave count, necessitating a reassessment of the market structure. This level acts as a key resistance, and breaching it could indicate a trend shift or wave pattern change.
Summary:
-
DOW JONES (DJI) is currently in a corrective phase within its Elliott Wave structure, with Orange Wave 2 now in play following the completion of Orange Wave 1.
-
This corrective movement is part of Navy Blue Wave 5, and the next significant move is anticipated to be Orange Wave 3.
-
Key Level to Monitor: 41801.74, as a breach of this level would invalidate the current wave count.
-
Understanding wave structures is essential for predicting potential market movements and aligning trading strategies effectively.
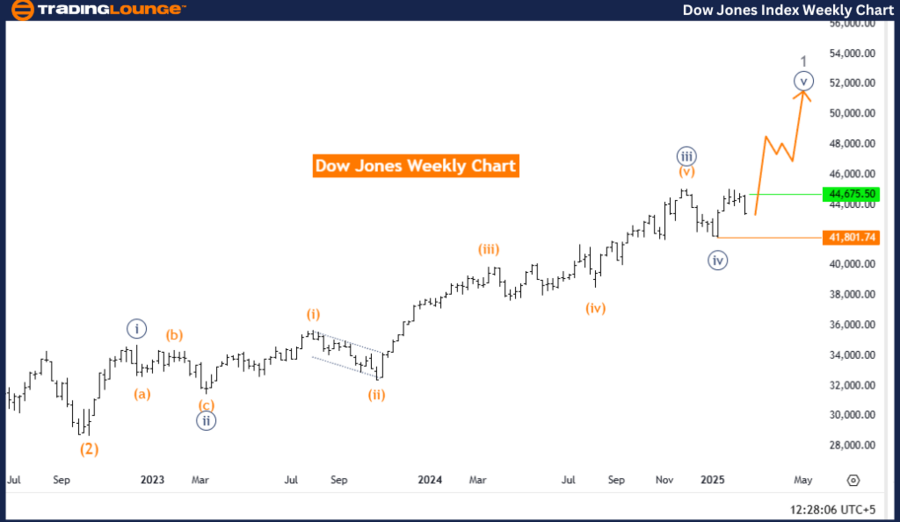
DOW JONES (DJI) Elliott Wave Analysis – Trading Lounge Weekly Chart.
DOW JONES (DJI) Elliott Wave technical analysis
-
Function: Bullish Trend.
-
Mode: Impulsive.
-
Structure: Navy Blue Wave 5.
-
Position: Gray Wave 1.
-
Direction next lower degrees: Gray Wave 2.
-
Wave cancel invalid level: 41801.74.
Analysis details:
The DOW JONES Industrial Average (DJI) Elliott Wave Analysis for the weekly chart reflects a bullish trend, with the market currently in an impulsive mode.
The structure is identified as Navy Blue Wave 5, which forms part of a larger upward movement within Gray Wave 1. This suggests the market is in a strong upward phase, characteristic of an impulsive wave structure. The next lower-degree movement expected is Gray Wave 2, anticipated to follow the completion of Navy Blue Wave 5.
The analysis indicates that Navy Blue Wave 4 has concluded, and the market is now progressing through Navy Blue Wave 5. This wave is expected to exhibit strong upward momentum, consistent with impulsive trends. Traders should monitor the development of Navy Blue Wave 5, as its completion may indicate the start of Gray Wave 2, a corrective phase that could lead to temporary pullbacks or consolidation before the trend resumes.
A critical level to watch is the Wave Cancellation Invalid Level at 41801.74. If the price drops below this level, the current wave count will be invalidated, necessitating a reassessment of the market structure. This level serves as a key support, and a breach could indicate a trend shift or wave pattern change.
Summary:
-
DOW JONES (DJI) is in a bullish trend, with Navy Blue Wave 5 currently in play following the completion of Navy Blue Wave 4.
-
The next expected movement is Gray Wave 2, which may bring a corrective phase.
-
Key Level to Monitor: 41801.74, as a breach of this level would invalidate the current wave count.
-
Understanding wave structures is essential for predicting potential market movements and aligning trading strategies effectively.
Technical analyst: Malik Awais.
DJI Elliott Wave technical analysis [Video]
Author

Peter Mathers
TradingLounge
Peter Mathers started actively trading in 1982. He began his career at Hoei and Shoin, a Japanese futures trading company.


