Disney (DIS Stock) failed the diagonal and the Irregular flat played out

Since the crash of March 2020, all stocks have tried to recover what they lost, and Disney was no exception. Disney did not only recover the lost, but It also reached historic highs. Now, we are going to try to build an impulse from the March 2020 lows with a target around $230. Target measured from 0 to 2019’s high projected from March’s low, equal legs. Since we begin with this analysis on February 13th, we bought the share in 160.97 – 165.89 area.
Disney daily chart
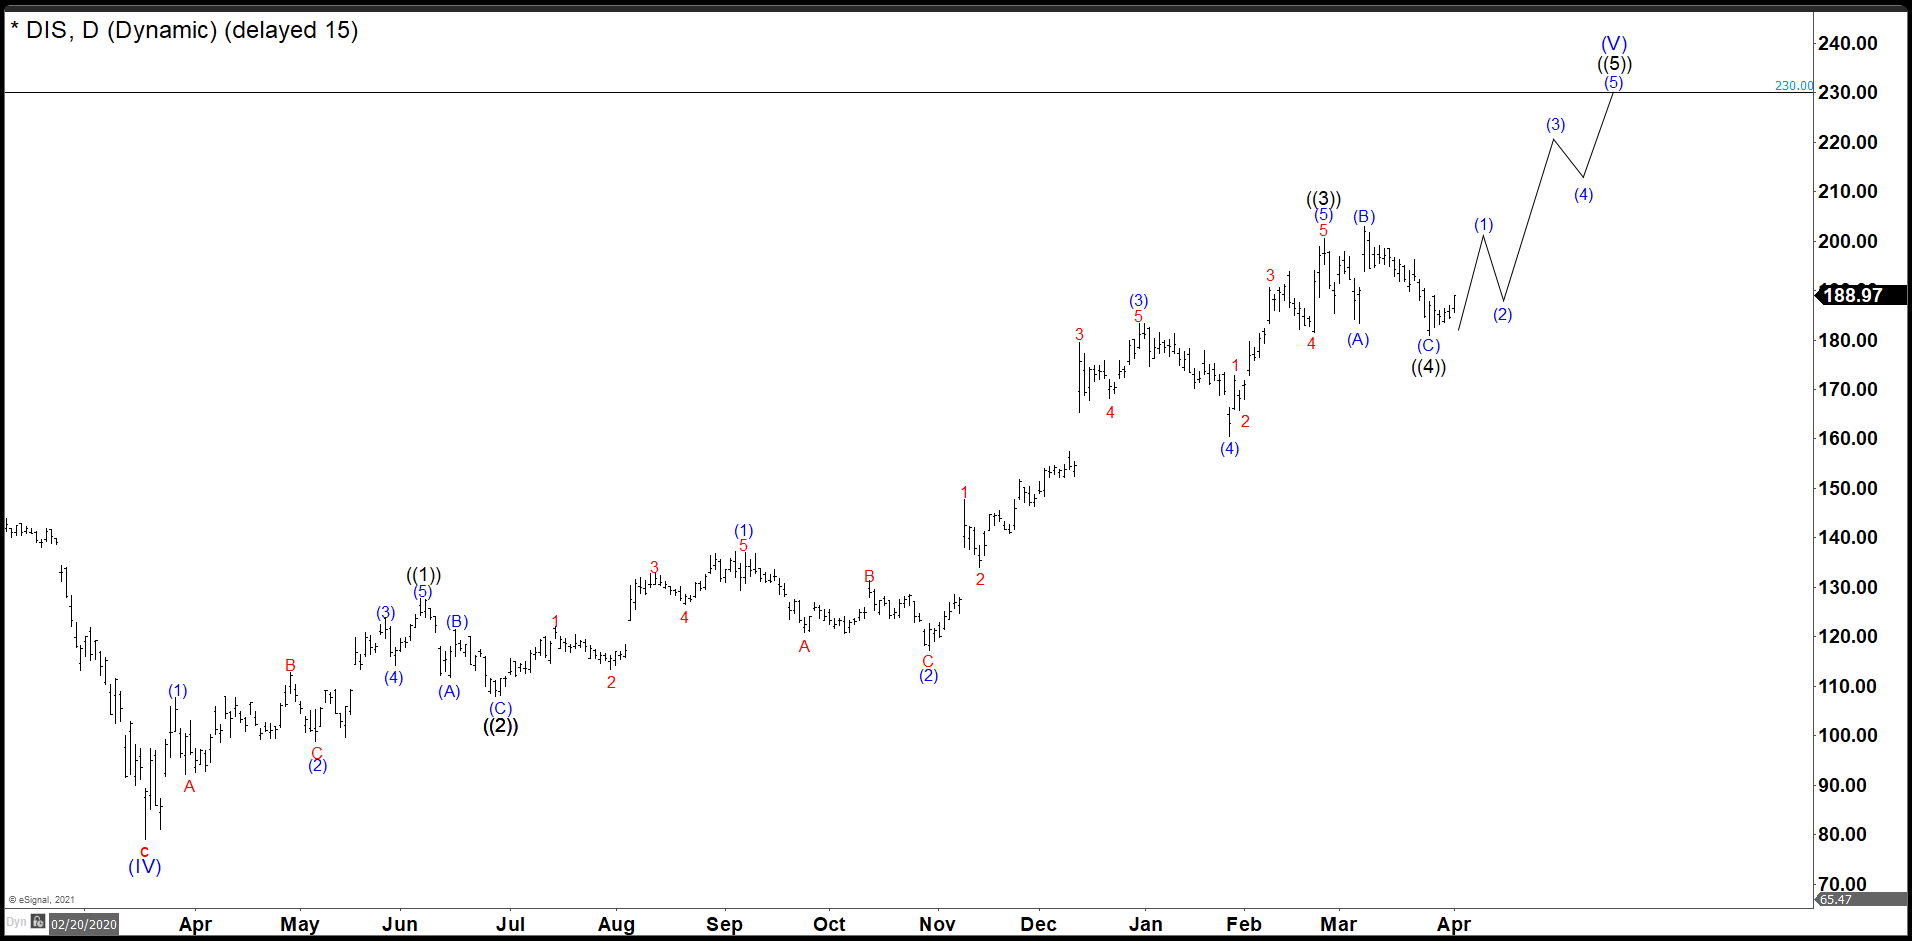
As we see in the daily chart, the waves ((1)), ((2)) and ((3)) of the impulse are done. We hit our first target at 190.88. The target gave us a return of +18.58% from 160.97. Weeks ago, we change our mind about the current structure of Disney. We believed the stock had to fail the irregular flat structure as wave ((4)) and we changed to an ending diagonal to complete ((3)) and then wait for the correction.
Last week, Disney dropped showing us that original idea of the irregular flat took place and even more the wave ((4)) could be ended at 180.14. Therefore, we should continue with the rally as we suggest for the next 2 months. Keep an eye that It is especially important to stay above around 180.00 dollars because a clear breaking of this zone could send Disney to retest 160.00 before reach 230.00. (If you want to learn more about Elliott Wave Theory, please follow this link: Elliott Wave Theory).
In Elliottwave Forecast we update one-hour charts 4 times a day and 4-hour charts once a day for all our 78 instruments. We do a daily live session where we guide our clients on the right side of the market. In addition, we have a chat room where our moderators will help you with any questions you have about what is happening in the market at the moment.
Premium
You have reached your limit of 3 free articles for this month.
Start your subscription and get access to all our original articles.
Author

Elliott Wave Forecast Team
ElliottWave-Forecast.com


