Digging deeper in VLUE

Value vs growth
When viewing the market through the factor lens, we find that there to be a compelling bifurcation between value and growth stocks. Indeed, value stocks have historically outperformed growth stocks over long periods, especially after extended runs in growth. Since 1926, U.S. value stocks have beaten growth stocks by an average of 2.5% annually, and periods of market rotation often favor value investing. Today, growth stocks are trading at historically high valuation multiples relative to value stocks. This makes value relatively more attractive.

www.spgi.com
While the S&P 500 itself currently trades at a historically high P/E ratio of 24.1x 2025e EPS, the S&P/Citi Growth index trades at a much higher P/E ratio of 30.1x 2025e EPS. Yet, this compares to just 19.6x for the S&P/Citi Value index. That’s a whopping 35% discount. Importantly, the Value / Growth ratio appears poised to test the intersection of the median line and an uptrend line established off the 2020 and 2021 lows. We would expect a rotation into value stocks from growth stocks if the equity market comes under pressure again in the back half of 2025.

www.stockcharts.com
Digging deeper in VLUE
Given the disparity, we believe the shares of the iShares MSCI USA Value Factor ETF (VLUE) represents an interesting way to position for such a potential rotation and subsequent narrowing of the valuation spread. VLUE seeks to track the investment results of an index composed of U.S. large and mid-capitalization stocks with value characteristics and relatively lower valuations. The top ten portfolio holdings as of March 31st are as follows:

www.ishares.com
Chart perspectives on VLUE
The shares of VLUE have resolved above a multi-year classic patterned base formation of the “Cup & Handle” variety. The bullish inflection above $115, if sustained, projects a measured move to approximately $148 [($115 – $82) + $115 = $148], equating to a potential 28% gain.

www.stockcharts.com
The multivariate momentum study, as illustrated in the lower panel of the chart above, suggests that momentum at multiple degrees of trend is beginning to turn up from its recent lows. Point & Figure analysis, as illustrated in the chart below, projects an even higher price objective of $164 using the three-box reversal method.
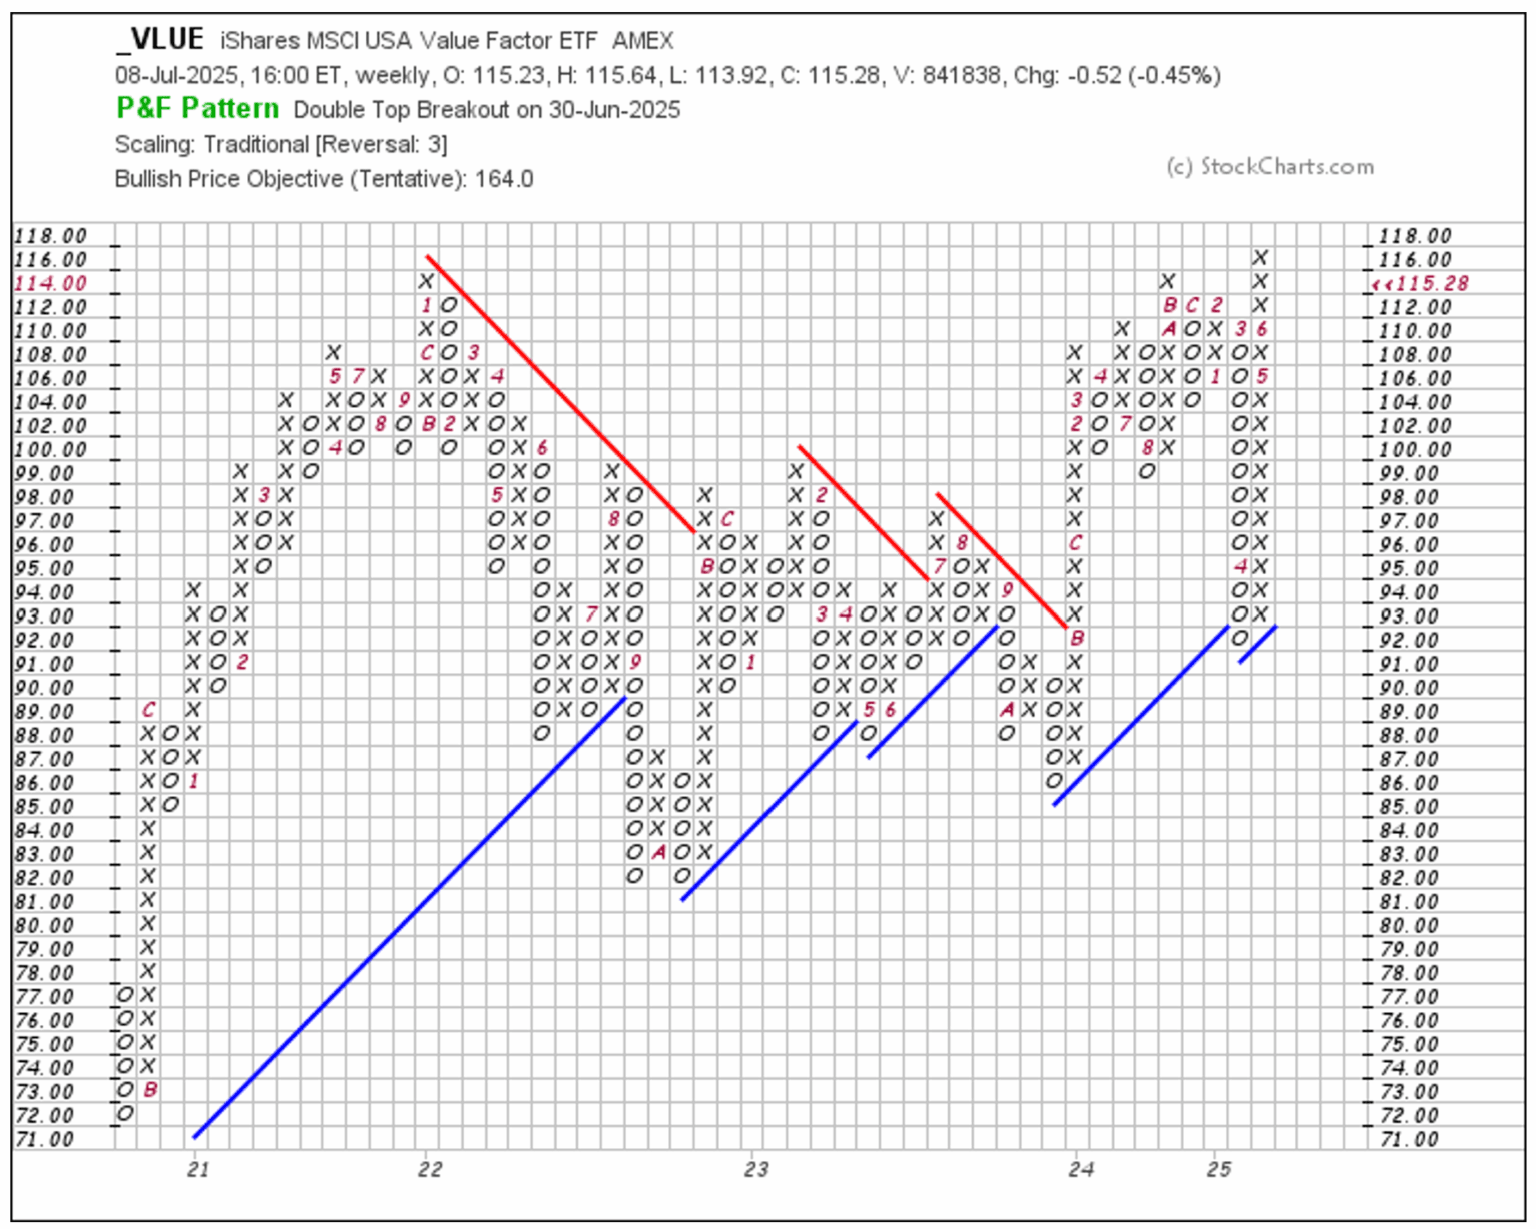
www.stockcharts.com
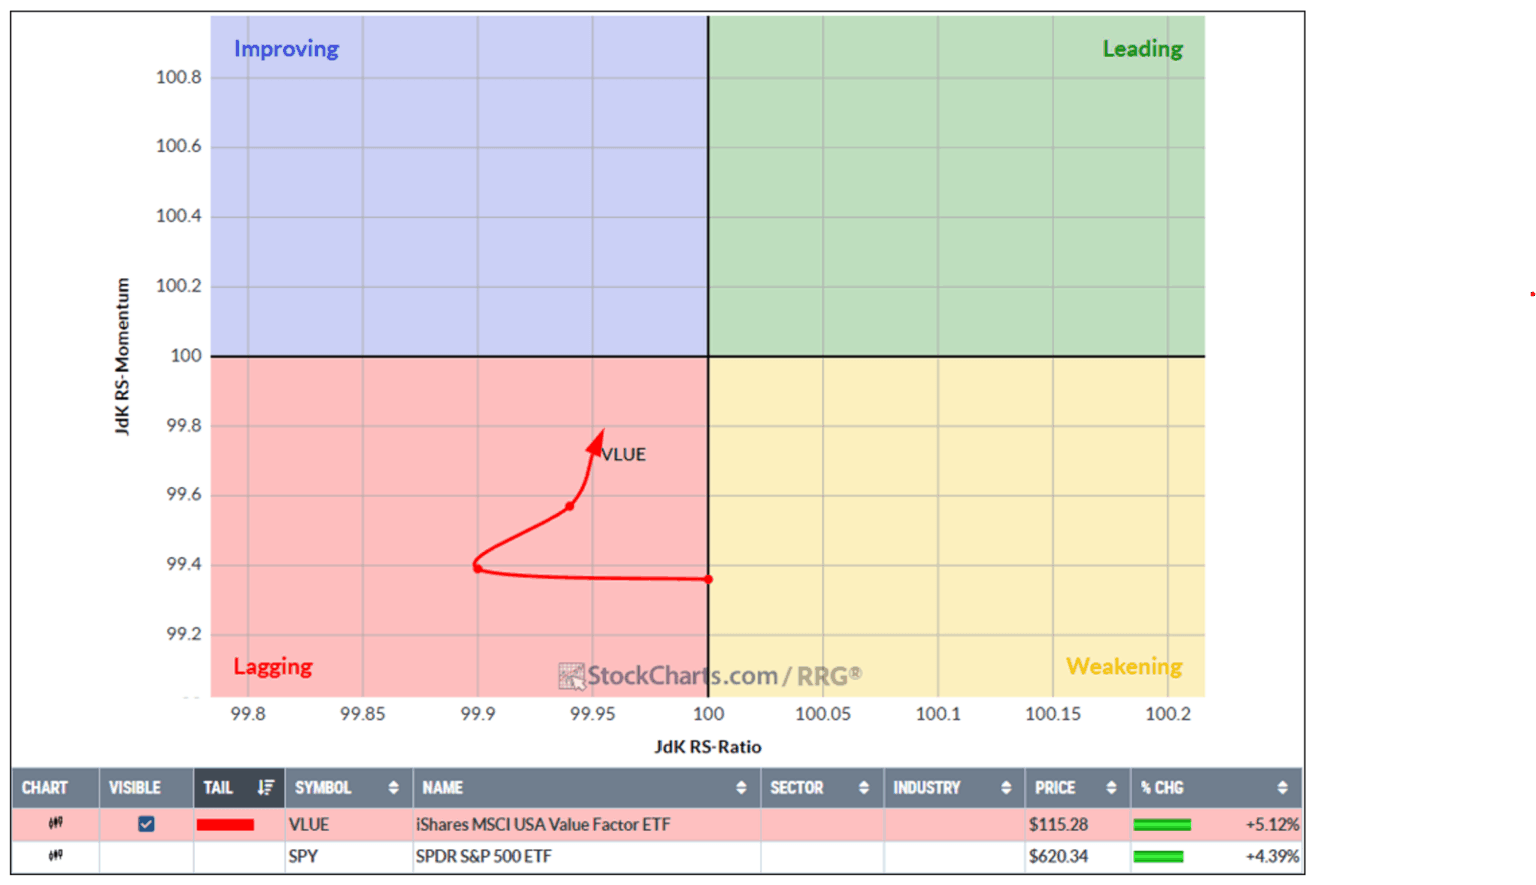
A relative strength perspective on VLUE
The shares of VLUE are also leading the S&P 500 index by over 400 bps YTD, and are the second-best performing factor over the past month behind High Beta. While its weekly RS-Ratio rotated into the lagging quadrant, it did a 180-degree turn last week and appears poised to rotate into the improving quadrant over the subsequent weeks.
www.stockcharts.com
Trading VLUE
In our opinion, VLUE represents an attractive candidate for new money equity allocations. A limit of $115 on the entry price combined with an initial stop-loss provision set at $109 would limit downside risk to about 5.2% of capital deployed and establish a very attractive 5-to-1 positive risk skew.
Unlock exclusive gold and silver trading signals and updates that most investors don’t see. Join our free newsletter now!
Unlock exclusive gold and silver trading signals and updates that most investors don’t see. Join our free newsletter now!
Author

CMT Association Research Team
CMT Association
The CMT Association is a global credentialing body that has served the financial industry for nearly 50 years.


