|

Crude Oil WTI Technical Analysis: Black Gold stabilizing after the recent carnage and climactic selloff - Bull target at $59.00 a barrel

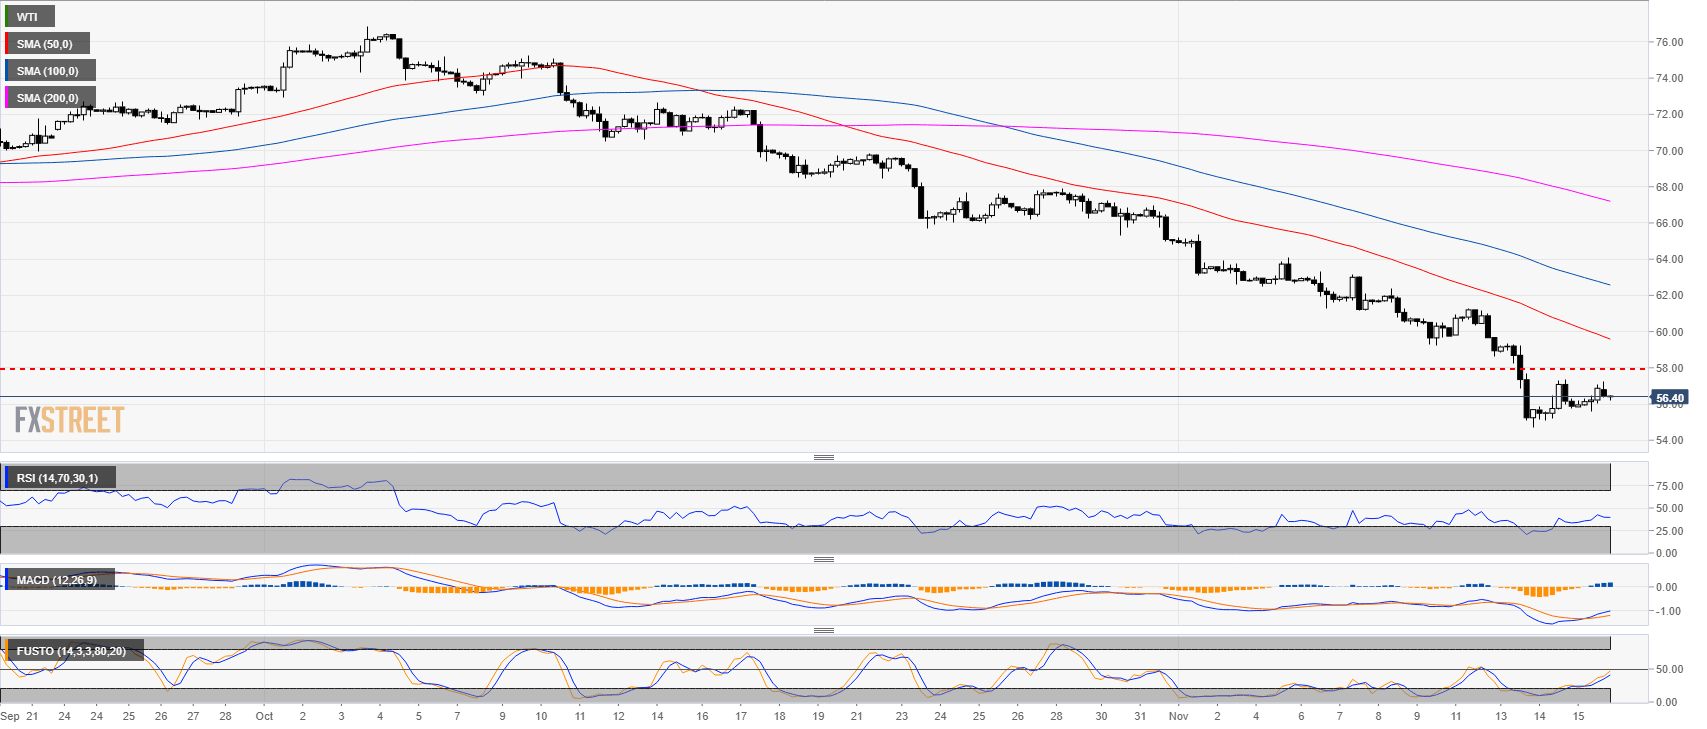
Crude oil weekly chart

  • Crude oil has erased the yearly gains as it plunged below the 58.00 level.


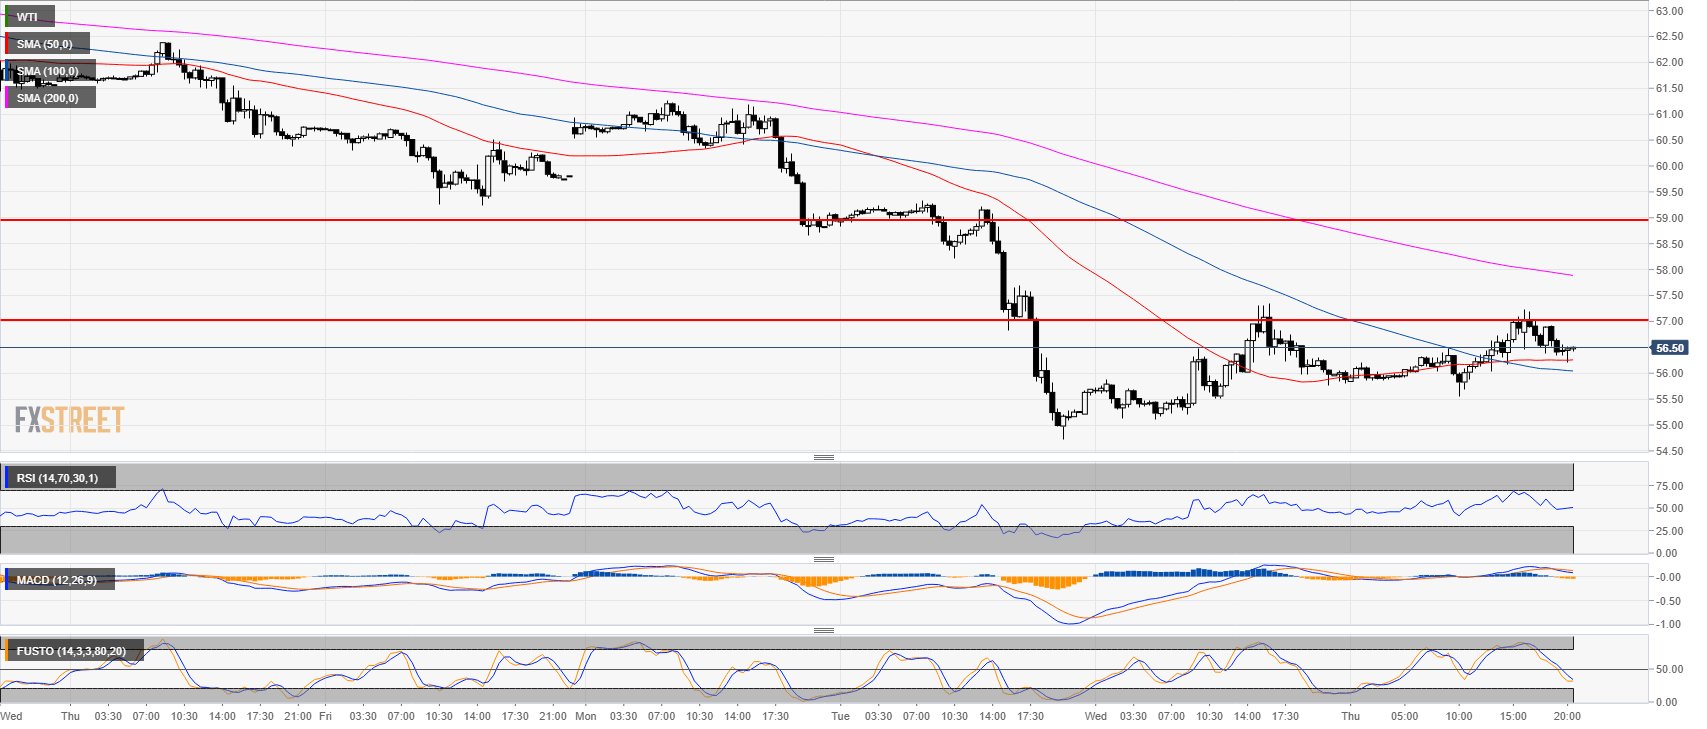
Crude oil 4-hour chart


  • Oil is trading in a steep bear trend below the 50, 100 and 200-period simple moving average. 
  • The MACD indicator crossed over from below while the RSI and Stochastic are rising but still below the 50 line. 
  • Oil is far away from its 50 SMA. All suggesting potential oversold condition.


Crude oil 30-minute chart

  • Bulls are trying to break above $57.00 a barrel. They tried to do so on Wednesday and this Thursday.
  • The 50 and 100 SMA are supporting the market. 
  • A successful break would most likely lead to a strong bullish recovery to 59.00.


Additional key levels at a glance:


WTI

Overview:
    Last Price: 56.47
    Daily change: 59 pips
    Daily change: 1.06%
    Daily Open: 55.88
Trends:
    Daily SMA20: 63.01
    Daily SMA50: 68.5
    Daily SMA100: 68.37
    Daily SMA200: 68.35
Levels:
    Daily High: 56.06
    Daily Low: 55.81
    Weekly High: 63.05
    Weekly Low: 59.24
    Monthly High: 76.25
    Monthly Low: 64.86
    Daily Fibonacci 38.2%: 55.91
    Daily Fibonacci 61.8%: 55.96
    Daily Pivot Point S1: 55.77
    Daily Pivot Point S2: 55.67
    Daily Pivot Point S3: 55.52
    Daily Pivot Point R1: 56.02
    Daily Pivot Point R2: 56.17
    Daily Pivot Point R3: 56.27

Author

Flavio Tosti

Flavio Tosti

Independent Analyst


More from Flavio Tosti
Share:

Editor's Picks

EUR/USD keeps the offered stance just above 1.1700

EUR/USD is coming under heavy selling pressure in what has been a rather grim start to the new trading week, with the pair now trading close to the 1.1700 support area as the US Dollar stages a solid rebound. The prevailing flight to safety mood continues to favour the Greenback, as investors react to the escalating conflict in the Middle East and trim risk exposure across the board.

GBP/USD hits new yearly lows near 1.3300

GBP/USD adds to the recent bearish tone, approaching to the key 1.3300 support to reach fresh YTD troughs against the backdrop of the robust performance of the US Dollar. Indeed, Cable’s decline comes amid the firm demand for the safe-haven space in the wake of the US and Israel attacks to Iran.

Gold battles to retain the positive momentum

Gold now surrenders part of the earlier advance past the $5,400 mark per troy ounce at the beginning of the week. Indeed, the precious metal’s strong uptick remains fuelled by increasing geopolitical tensions in the Middle East amid the intense demand for safer assets.

Bitcoin on brink of breakdown amid US-Iran war

Bitcoin (BTC) remains under pressure near the key support level of $65,700. Trading at $66,400 at the time of writing on Monday, a breakdown below this critical level would suggest a deeper correction ahead.

The Fed is finally talking about AI – Here's why it matters for the US Dollar

AI is moving from earnings calls into the heart of monetary policy discussions, forcing Federal Reserve officials to confront a new question: How to act if AI reshapes inflation, employment and interest rates at the same time?

Grass 20% bullish breakout defies broader market weakness

Grass (GRASS) is edging up above $0.30 at the time of writing on Monday. The token’s notable 20% intraday surge stands out amid heightened volatility in the broader crypto market.