|

Crude Oil sees a bounce on Friday, still set for another down week with WTI below $72

  • WTI's Friday bounce still sees Crude Oil down for a seventh straight week.
  • US Crude Oil fell to a near-term floor of $69.01 on Thursday.
  • OPEC's pumping caps are seeing little impact as Chinese demand slumps.

Crude Oil markets are seeing a moderate recovery on Friday with West Texas Intermediate (WTI) climbing two percent on the day, but pressured oil markets are still set for a seventh straight week of declines.

The Organization of the Petroleum Exporting Countries (OPEC) scrambled to solidify a group-wide agreement on production cuts after member states came to loggerheads over pumping quotas. Key OPEC members, headed up by Saudi Arabia, have aggressively pursued tighter production caps in order to keep Crude Oil prices bid. However, flagging fuel demand, specifically from China, and disobedient OPEC member states decrying production caps are throwing a wrench in OPEC’s efforts to intentionally undersupply global Crude Oil Markets.

OPEC’s current production caps see the oil cartel agreeing to a combined 2.2 million bpd cut to total Crude Oil production through the first quarter of 2024, but fossil markets remain skeptical about OPEC’s ability to enforce the loose agreement.

OPEC currently has no mechanism of enforcing Crude Oil production quotas, and there is currently no punishment for member countries that choose to flaunt pumping limits and sell more oil than OPEC agreements allow.

Adding fuel to the fire, Chinese imports of Crude Oil declined by 9% in November compared to last year as Chinese demand for fossil fuels sumps alongside China’s growth metrics. 

Despite OPEC’s production-limiting efforts, Crude Oil supplies remain well-stocked with barrel inventories at healthy levels, sending the price of Crude down into multi-month lows.

WTI Technical Outlook

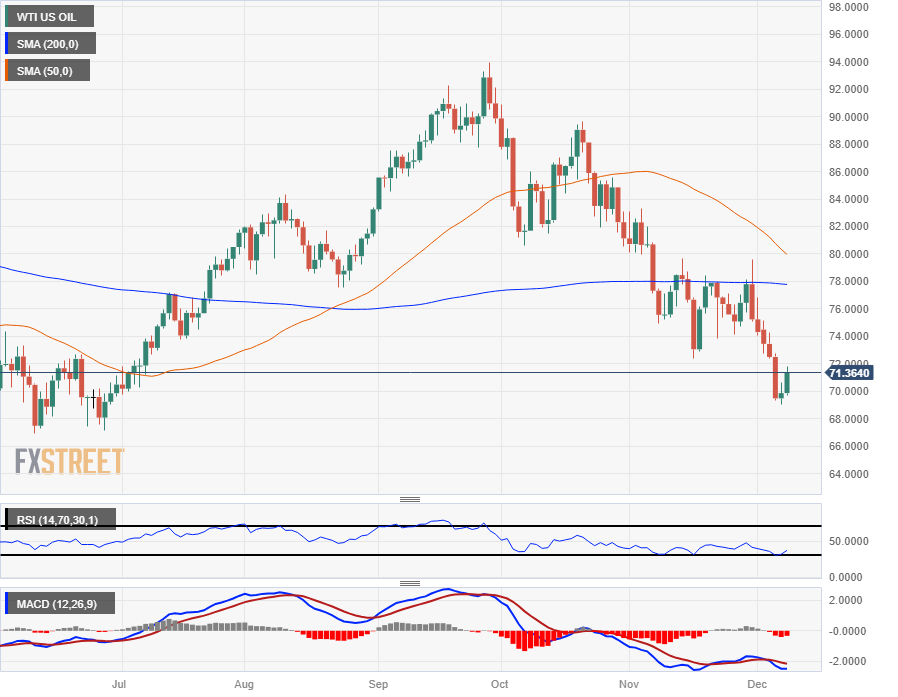
Despite Friday’s rebound after finding a floor on Thursday at $69.01, Crude Oil remains firmly under-bid after closing in the red for five consecutive days into Tuesday, and WTI is on pace to end in the red for a seventh straight week.

WTI Crude Oil daily candlesticks remain firmly capped by the 200-day Simple Moving Average (SMA) near $78.00, with the 50-day SMA accelerating into the downside at $80.00.

Seven straight weeks of declines have dragged WTI down nearly twenty percent plus a half from the last peak of $89.64, and US Crude Oil is down nearly twenty-seven percent from September’s peak just below $94.00 per barrel.

WTI Daily Chart

WTI Technical Levels

WTI US OIL

Overview
Today last price71.3
Today Daily Change1.44
Today Daily Change %2.06
Today daily open69.86
 
Trends
Daily SMA2075.4
Daily SMA5080.34
Daily SMA10082.09
Daily SMA20077.81
 
Levels
Previous Daily High70.64
Previous Daily Low69.01
Previous Weekly High79.62
Previous Weekly Low74.04
Previous Monthly High83.34
Previous Monthly Low72.39
Daily Fibonacci 38.2%70.01
Daily Fibonacci 61.8%69.63
Daily Pivot Point S169.03
Daily Pivot Point S268.21
Daily Pivot Point S367.41
Daily Pivot Point R170.66
Daily Pivot Point R271.46
Daily Pivot Point R372.29

Author

Joshua Gibson

Joshua joins the FXStreet team as an Economics and Finance double major from Vancouver Island University with twelve years' experience as an independent trader focusing on technical analysis.

More from Joshua Gibson
Share:

Markets move fast. We move first.

Orange Juice Newsletter brings you expert driven insights - not headlines. Every day on your inbox.

By subscribing you agree to our Terms and conditions.

Editor's Picks

EUR/USD eases toward 1.1700 as USD finds fresh demand

EUR/USD eases toward the 1.1700 mark in early Europe on Friday. The pair faces headwinds from a renewed uptick in the US Dollar as investors look past softer US inflation data. However, the EUR/USD downside appears capped by expectations of Fed-ECB monetary policy divergence. 

GBP/USD steadies below 1.3400 as traders digest BoE policy update and US inflation data

The GBP/USD pair stalls the previous day's pullback from the vicinity of mid-1.3400s and a nearly two-month high, though it struggles to attract meaningful buyers during the Asian session on Friday. Spot prices currently trade around the 1.3380-1.3385 region, up only 0.05% for the day, amid mixed cues.

Gold seems vulnerable as USD bulls shrug off softer US CPI

Gold extends the previous day's late pullback from the vicinity of the record high and attracts some follow-through selling during the Asian session on Friday. The US CPI report released on Thursday pointed to cooling of inflationary pressure.

Bitcoin, Ethereum and Ripple correction slide as BoJ rate decision weighs on sentiment

Bitcoin, Ethereum, and Ripple are extending their correction phases after losing nearly 3%, 8%, and 10%, respectively, through Friday. The pullback phase is further strengthened as the upcoming Bank of Japan’s rate decision on Friday weighs on risk sentiment, with BTC breaking key support, ETH deepening weekly losses, and XRP sliding to multi-month lows.

Bank of England cuts rates in heavily divided decision

The Bank of England has cut rates to 3.75%, but the decision was more hawkish than expected, leaving market rates higher and sterling slightly stronger. It's a close call whether the Bank cuts again in February or March.

Ethereum Price Forecast: EF outlines ways to solve growing state issues

Ethereum price today: $2,920. The EF noted that Ethereum's growing state could lead to centralization and weaken censorship resistance. The Stateless Consensus team outlined state expiry, state archive and partial statelessness as potential solutions to the growing state load.