Crude Oil faces some profit taking ahead of the weekend after upbeat Nonfarm Payrolls print
- Crude Oil eases a touch while over 8% of gains are set to be locked in for this week's performance.
- US President Joe Biden said on Thursday talks are ongoing with Israel on whether it may attack Iranian oil fields.
- The US Dollar Index shoots through the roof after stellar Nonfarm Payrolls print urges traders to wind down Fed rate cut bets.

Crude Oil is seeing a constant repricing of risk premium being added this week, accumulating more than 8% price rise since its opening on Monday. With tensions not easing in Lebanon, more risk is being priced in after headlines emerged that Israel was seeking green light from the Biden administration to target Oil installations in Iran. Concerns about such an attack, which could disrupt supply, set the tone to come over the weekend and into next week, with a ceasefire deal looking further away than ever.
The US Dollar Index (DXY), which tracks the performance of the Greenback against six other currencies, is trading broadly flat this Friday after a steep four-day rally. The US Dollar Index is moving higher and is set to close off thsi week with a five day winning streak and a US Dollar which is over 2% stronger than where it opened on Monday. The move comes with the Nonfarm Payrolls print coming in substantially higher at 254,000 against 150,000 expected.
At the time of writing, Crude Oil (WTI) trades at $73.91 and Brent Crude at $77.97
Oil news and market movers: US Jobs Report means minor blow to Crude rally
- The upbeat US Jobs Report that saw Nonfarm Payrolls jump to254,000 against the expected 150,000 has triggered an unwind in the sizes of rate cuts expected from the Fed for the coming months. With that, the boost and surge in demand for Oil could be diminished and be less a driver for Oil prices as it was when multiple big rate cuts were still priced in.
- Oil prices could rally further if there's any response by Israel to Iran's October 1 missile attack that targets Oil-related infrastructure. Further retaliation by Iran based on a blockade of the Strait of Hormuz could raise the price of crude to north of $100 a barrel, Bloomberg Intelligence reports.
- A spillover effect is taking place in petrol prices as Israel ponders a hit on Iranian Oil fields, Financial Review reports.
- US President Joe Biden said on Thursday that he was still discussing possible Israeli strikes on Iranian Oil facilities. The President refused to comment on whether he agrees with the path forward that Israel is asking, according to BBC.
- At 17:00 GMT, the Baker Hughes Oil Rig Count is due. The previous count came in at 484 rigs in the Gulf region.
Economic Indicator
Baker Hughes US Oil Rig Count
The Baker Hughes Rig Counts are an important business barometer for the drilling industry and its suppliers. When drilling rigs are active they consume products and services produced by the oil service industry. The active rig count acts as a leading indicator of demand for products used in drilling, completing, producing and processing hydrocarbons. This particular case represents the number of rigs drilling exclusively for oil.
Read more.Next release: Fri Oct 04, 2024 17:00
Frequency: Irregular
Consensus: -
Previous: 484
Source: Baker Hughes
Oil Technical Analysis: End of the line for now
Crude Oil price action is keeping technical writers at work with one pivotal level after another being broken. On Thursday, the 55-day Simple Moving Average (SMA) at $72.77 was the last victim of the rally. Although $75.00 is still a stretch away, prices could reach that level if Israel gets the green light of the US to attack Oil installations.
The new pivotal upside level is first $75.27. That level coincides with the red descending trendline and the 100-day SMA at $75.77 just hovering above it. That makes that region a very difficult one to break through. Once snapping above there, the 200-day SMA at $77.10 should refute any further upticks.
On the downside, old resistances have turned into supports. First is the 55-day SMA at $72.77, which acts as a potential first line of defence in case of any retreat. A bit further down, $71.46 comes into play as second support before looking back to the $70.00 big figure and $67.11 as ultimate support for traders that want to buy the dip.
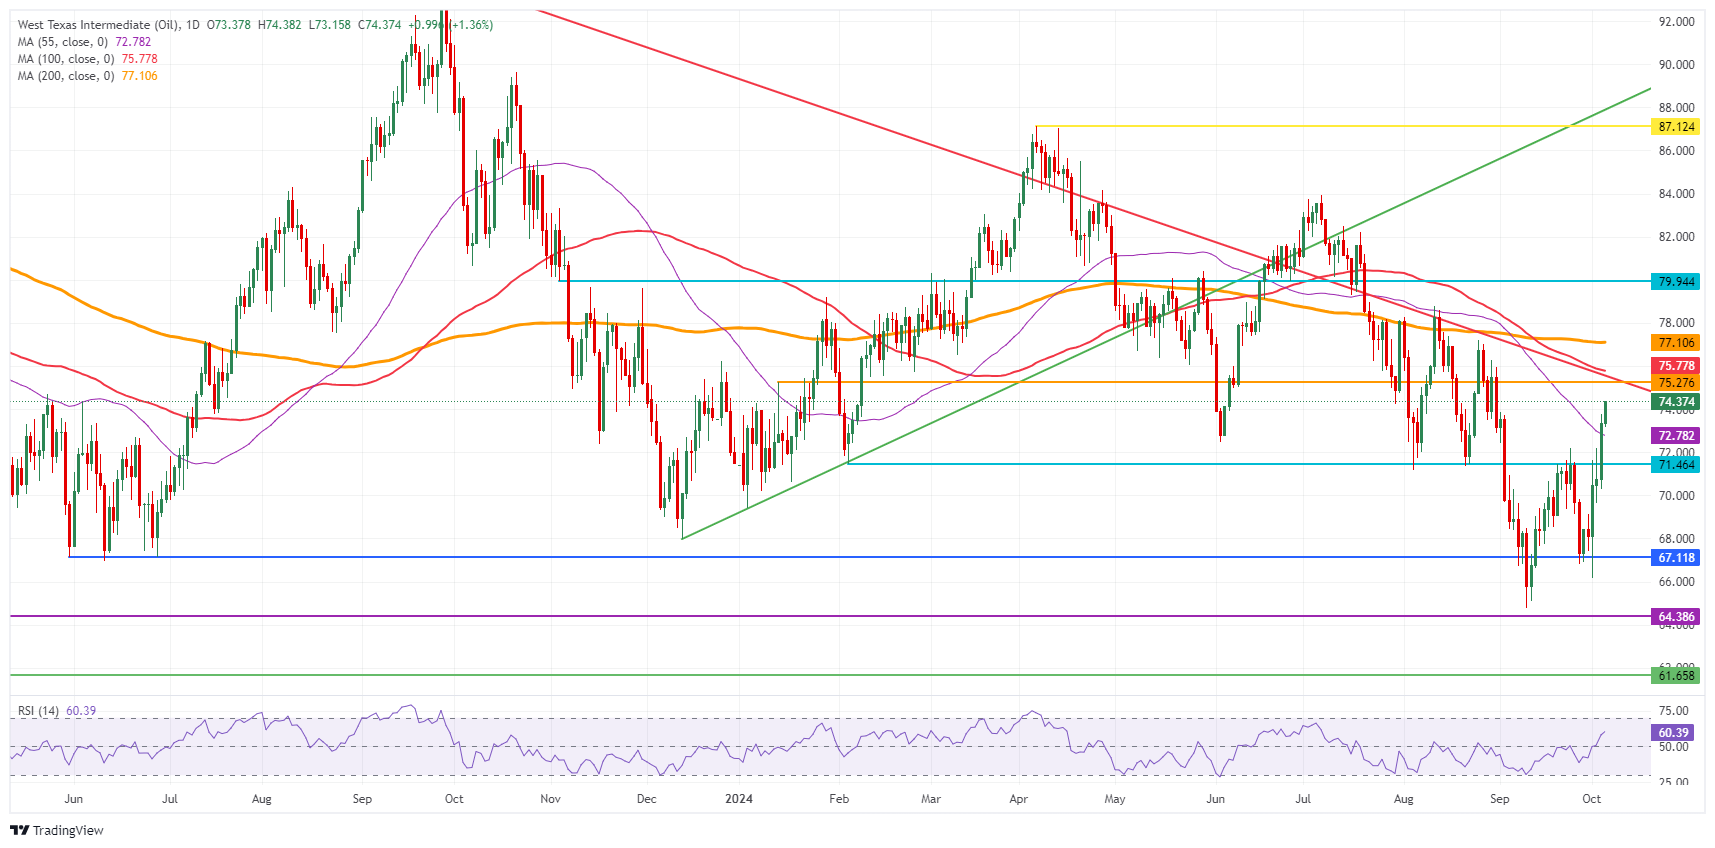
US WTI Crude Oil: Daily Chart
WTI Oil FAQs
WTI Oil is a type of Crude Oil sold on international markets. The WTI stands for West Texas Intermediate, one of three major types including Brent and Dubai Crude. WTI is also referred to as “light” and “sweet” because of its relatively low gravity and sulfur content respectively. It is considered a high quality Oil that is easily refined. It is sourced in the United States and distributed via the Cushing hub, which is considered “The Pipeline Crossroads of the World”. It is a benchmark for the Oil market and WTI price is frequently quoted in the media.
Like all assets, supply and demand are the key drivers of WTI Oil price. As such, global growth can be a driver of increased demand and vice versa for weak global growth. Political instability, wars, and sanctions can disrupt supply and impact prices. The decisions of OPEC, a group of major Oil-producing countries, is another key driver of price. The value of the US Dollar influences the price of WTI Crude Oil, since Oil is predominantly traded in US Dollars, thus a weaker US Dollar can make Oil more affordable and vice versa.
The weekly Oil inventory reports published by the American Petroleum Institute (API) and the Energy Information Agency (EIA) impact the price of WTI Oil. Changes in inventories reflect fluctuating supply and demand. If the data shows a drop in inventories it can indicate increased demand, pushing up Oil price. Higher inventories can reflect increased supply, pushing down prices. API’s report is published every Tuesday and EIA’s the day after. Their results are usually similar, falling within 1% of each other 75% of the time. The EIA data is considered more reliable, since it is a government agency.
OPEC (Organization of the Petroleum Exporting Countries) is a group of 12 Oil-producing nations who collectively decide production quotas for member countries at twice-yearly meetings. Their decisions often impact WTI Oil prices. When OPEC decides to lower quotas, it can tighten supply, pushing up Oil prices. When OPEC increases production, it has the opposite effect. OPEC+ refers to an expanded group that includes ten extra non-OPEC members, the most notable of which is Russia.
Author

Filip Lagaart
FXStreet
Filip Lagaart is a former sales/trader with over 15 years of financial markets expertise under its belt.


