Correction is retraced, but will stocks see further upside?

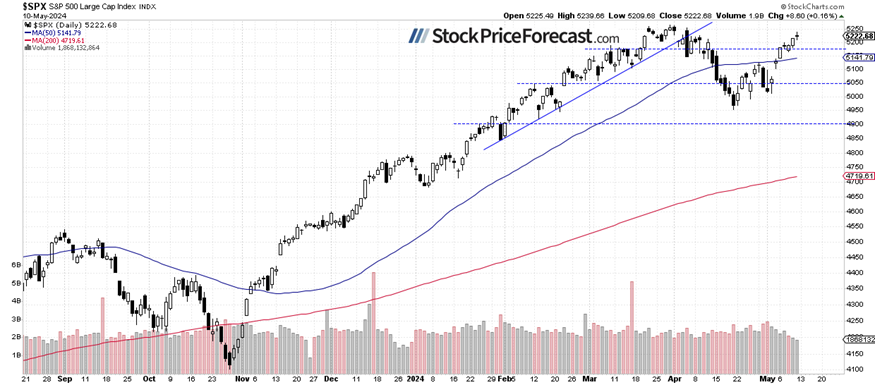
Friday’s trading session didn’t change that much, with the S&P 500 index gaining 0.16% and slightly extending its recent advances. The market reached a new local high of 5,239.66 and it was the highest since April 4. It has retraced almost all of its 311 points or 5.9% correction from the record high of 5,264.85 on February 28 to a local low of 4,953.56 on April 19. On Friday, the index was just 25 points below the all-time high.
The question arises: will the S&P 500 continue its bull market and reach a new record? It seems more and more likely; however, the index may see some short-term uncertainty as it approaches a series of the previous local highs and resistance levels. This morning, the futures contract is indicating a 0.2% higher opening for the index, with the market waiting for the important inflation data tomorrow and on Wednesday. Tomorrow, we will get the Producer Price Index, and on Wednesday, the key Consumer Price Index will be released.
On previous Wednesday, in my Stock Price Forecast for May, I noted “The question arises: Is this merely a correction or the beginning of a more significant downtrend? It's difficult to determine at this point. Last month, hopes for a Fed pivot were dashed as new data reignited inflation fears, and geopolitical tensions added further uncertainty. However, as of today, it appears the market is only correcting a rally that began in November.”
Last week, the investor sentiment has clearly improved, as indicated by the Wednesday’s AAII Investor Sentiment Survey, which showed that 40.8% of individual investors are bullish, while only 23.8% of them are bearish, down from 32.5% last week. The AAII sentiment is a contrary indicator in the sense that highly bullish readings may suggest excessive complacency and a lack of fear in the market. Conversely, bearish readings are favorable for market upturns.
The S&P 500 approached a potential resistance level marked by its trading range from March and April, as we can see on the daily chart.
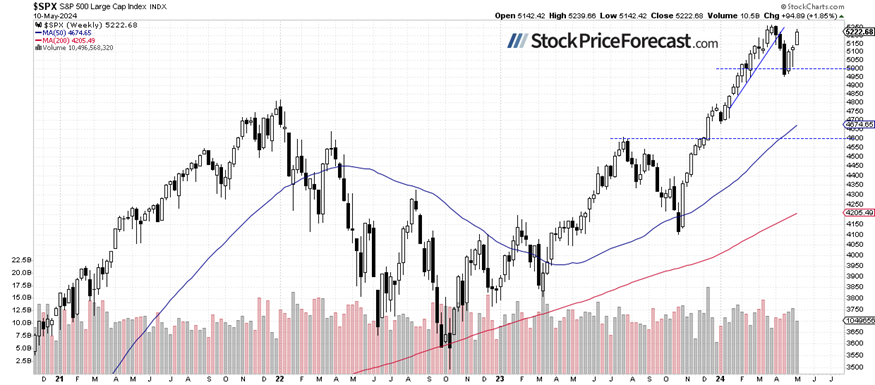
S&P 500 – Weekly gain of 1.85%
Compared to the previous Friday’s closing price, the index gained 1.85%, retracing more of its previous declines. The recent price action confirmed the importance of the 5,000 level as a medium-term support. It’s hard to say whether the market will continue its long-term uptrend; however, it will most likely remain above 5,000 in the coming weeks or months.
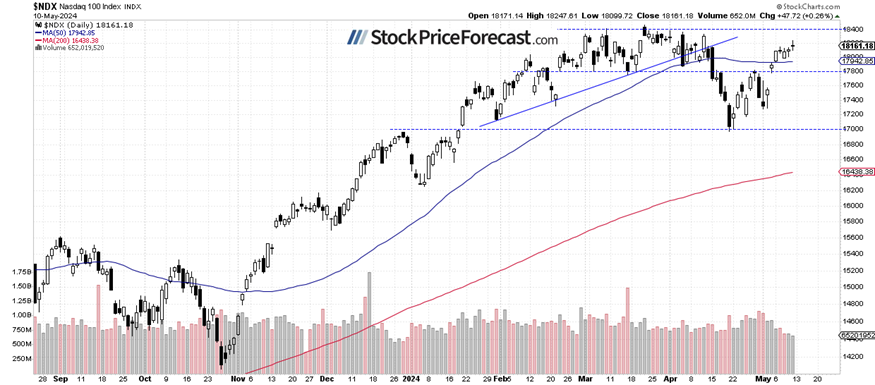
Nasdaq 100 – Closer to previous highs
Last week, the technology-focused Nasdaq 100 index has been mostly fluctuating along the 18,000 level. However, on Friday, it broke higher and retraced more of its previous declines. Potential resistance level remains at 18,400-18,500, marked by the March 21 record high of 18,464.70. Today, the tech stocks gauge is likely to open higher by 0.3%.
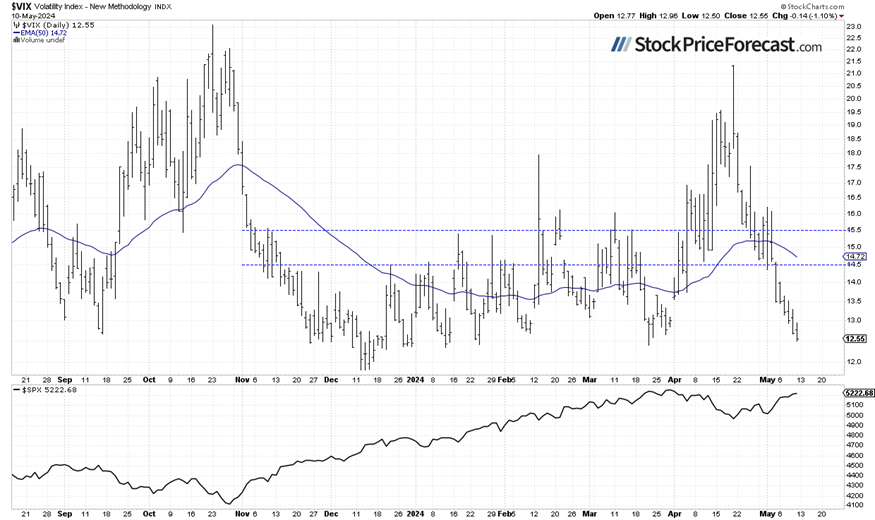
VIX continued lower
The VIX index, also known as the fear gauge, is derived from option prices. In late March, it was trading around the 13 level. However, market volatility has led to an increase in the VIX, and on April 19, it reached a local high of 21.4 - the highest since late October, signaling fear in the market. Recently it was going lower again, and on Friday, it was as low as 12.50, showing complacency in the market.
Historically, a dropping VIX indicates less fear in the market, and rising VIX accompanies stock market downturns. However, the lower the VIX, the higher the probability of the market’s downward reversal.
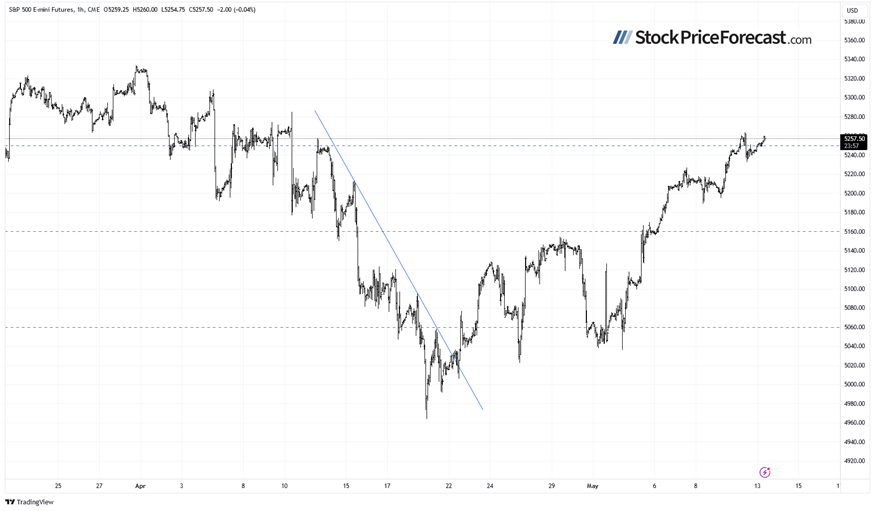
Futures contract remains close to 5,250
Let’s take a look at the hourly chart of the S&P 500 futures contract. On Friday, it retraced some of the recent advances; however, it managed to come back closer to local highs, and this morning, it’s trading along the 5,250 level again.
The resistance level is at 5,300, and the support level is at 5,200-5,220, marked by the recent trading range.
Conclusion
The S&P 500 is likely to remain close to its last week’s local highs after extending a rebound from late April low and retracing almost all of its 5.9% downward correction. However, the market neared the resistance area marked by local highs from March and April, and it may face a more pronounced profit-taking action at some point.
Last Tuesday, I wrote “(…) the market may pause or even retrace some gains. With most of the earnings season over (there is only one very important release left - NVDA on May 22) and the FOMC Rate Decision release behind us, expect a period of uncertainty.”
The uncertainty seems to be gone, but the overall very bullish sentiment coupled with low VIX readings may be worrying for the market in the short-term. Some profit-taking may be on the horizon; however, the inflation data this week will likely cause more volatility.
In my Stock Price Forecast for May, I noted “Where will the market go in May? There's a popular saying: 'Sell in May and go away,' but statistics don't consistently support such clear seasonal patterns or cycles. The safe bet for May is likely sideways trading, with investors digesting recent data suggesting that inflation may not be transitory, and the Fed could maintain its relatively tight monetary policy. However, economic data isn't entirely negative, and strong earnings from companies may continue to fuel the bull market.”
For now, my short-term outlook remains neutral.
Here’s the breakdown:
-
The S&P 500 is expected to trade along its local highs today as markets await key inflation data on Tuesday and Wednesday.
-
On Friday, April 19, stock prices were the lowest since February, indicating a correction of the medium-term advance. Recently, the S&P 500 retraced all of its mid-April sell-off.
-
In my opinion, the short-term outlook is neutral.
The full version of today’s analysis - today’s Stock Trading Alert - is bigger than what you read above, and it includes the additional analysis of the Apple (AAPL) stock and the current S&P 500 futures contract position. I encourage you to subscribe and read the details today. Stocks Trading Alerts are also a part of our Diamond Package that includes Gold Trading Alerts and Oil Trading Alerts.
Want free follow-ups to the above article and details not available to 99%+ investors? Sign up to our free newsletter today!
Want free follow-ups to the above article and details not available to 99%+ investors? Sign up to our free newsletter today!
Author

Paul Rejczak
Sunshine Profits
Paul Rejczak is a stock market strategist who has been known for the quality of his technical and fundamental analysis since the late nineties.


