Citigroup Inc (C) Stock Price and Forecast: Citi results will be keenly watched on Friday
- Citigroup (C) will announce earnings later this week on Friday.
- Financial stocks have started 2022 strongly, benefitting from higher yields.
- Citi (C) and others also benefit from a rotatation out of growth.
Citigroup (C) shares kicked on last Friday continuing their recent strong start to the year. 2022 so far has seen the Fed adopt an aggressive posture which has not endeared investors toward growth stocks. The Nasdaq has stuttered into 2022 but financial stocks, by comparison, are powering ahead. Apologies if some readers find this self-explanatory but higher interest rates are generally good for commercial bank stocks who can increase the margin between deposits and borrowings. This flows directly to the bottom line for little additional costs. So far Citigroup (C) stock is up 9% for 2022.
Citigroup (C) stock news
Not stock specific but certainly related to the times we live in, various outlets report that Citi is preparing to fire workers who refuse to be vaccinated against covid. Bloomberg says the deadline is the end of January, it appears they were the first to break the news. Workers will be placed on leave on January 14 if they are not vaccinated.
Back to financial matters now and all eyes will be on Citigroup's earnings this Friday. Earnings per share (EPS) is slated to come in at $1.71 and revenue is estimated to hit $16.98 billion. Citi has surprised to the upside for the last number of quarters. Indeed we have to go back to 2017 for the last time EPS did not come in ahead of results. Revenue did miss slightly in Q4 last year but otherwise, it has been a continuous string of earnings beats. With many analysts now penciling in an even more aggressive Fed than thought, this should further underpin financial stocks performance.
Citigroup (C) stock forecast
Citi (C) put in a perfect double bottom between February and December 2021. A double bottom is a strongly bullish reversal signal and so it has proven. Last week the stock put in a huge green candle on the weekly chart.
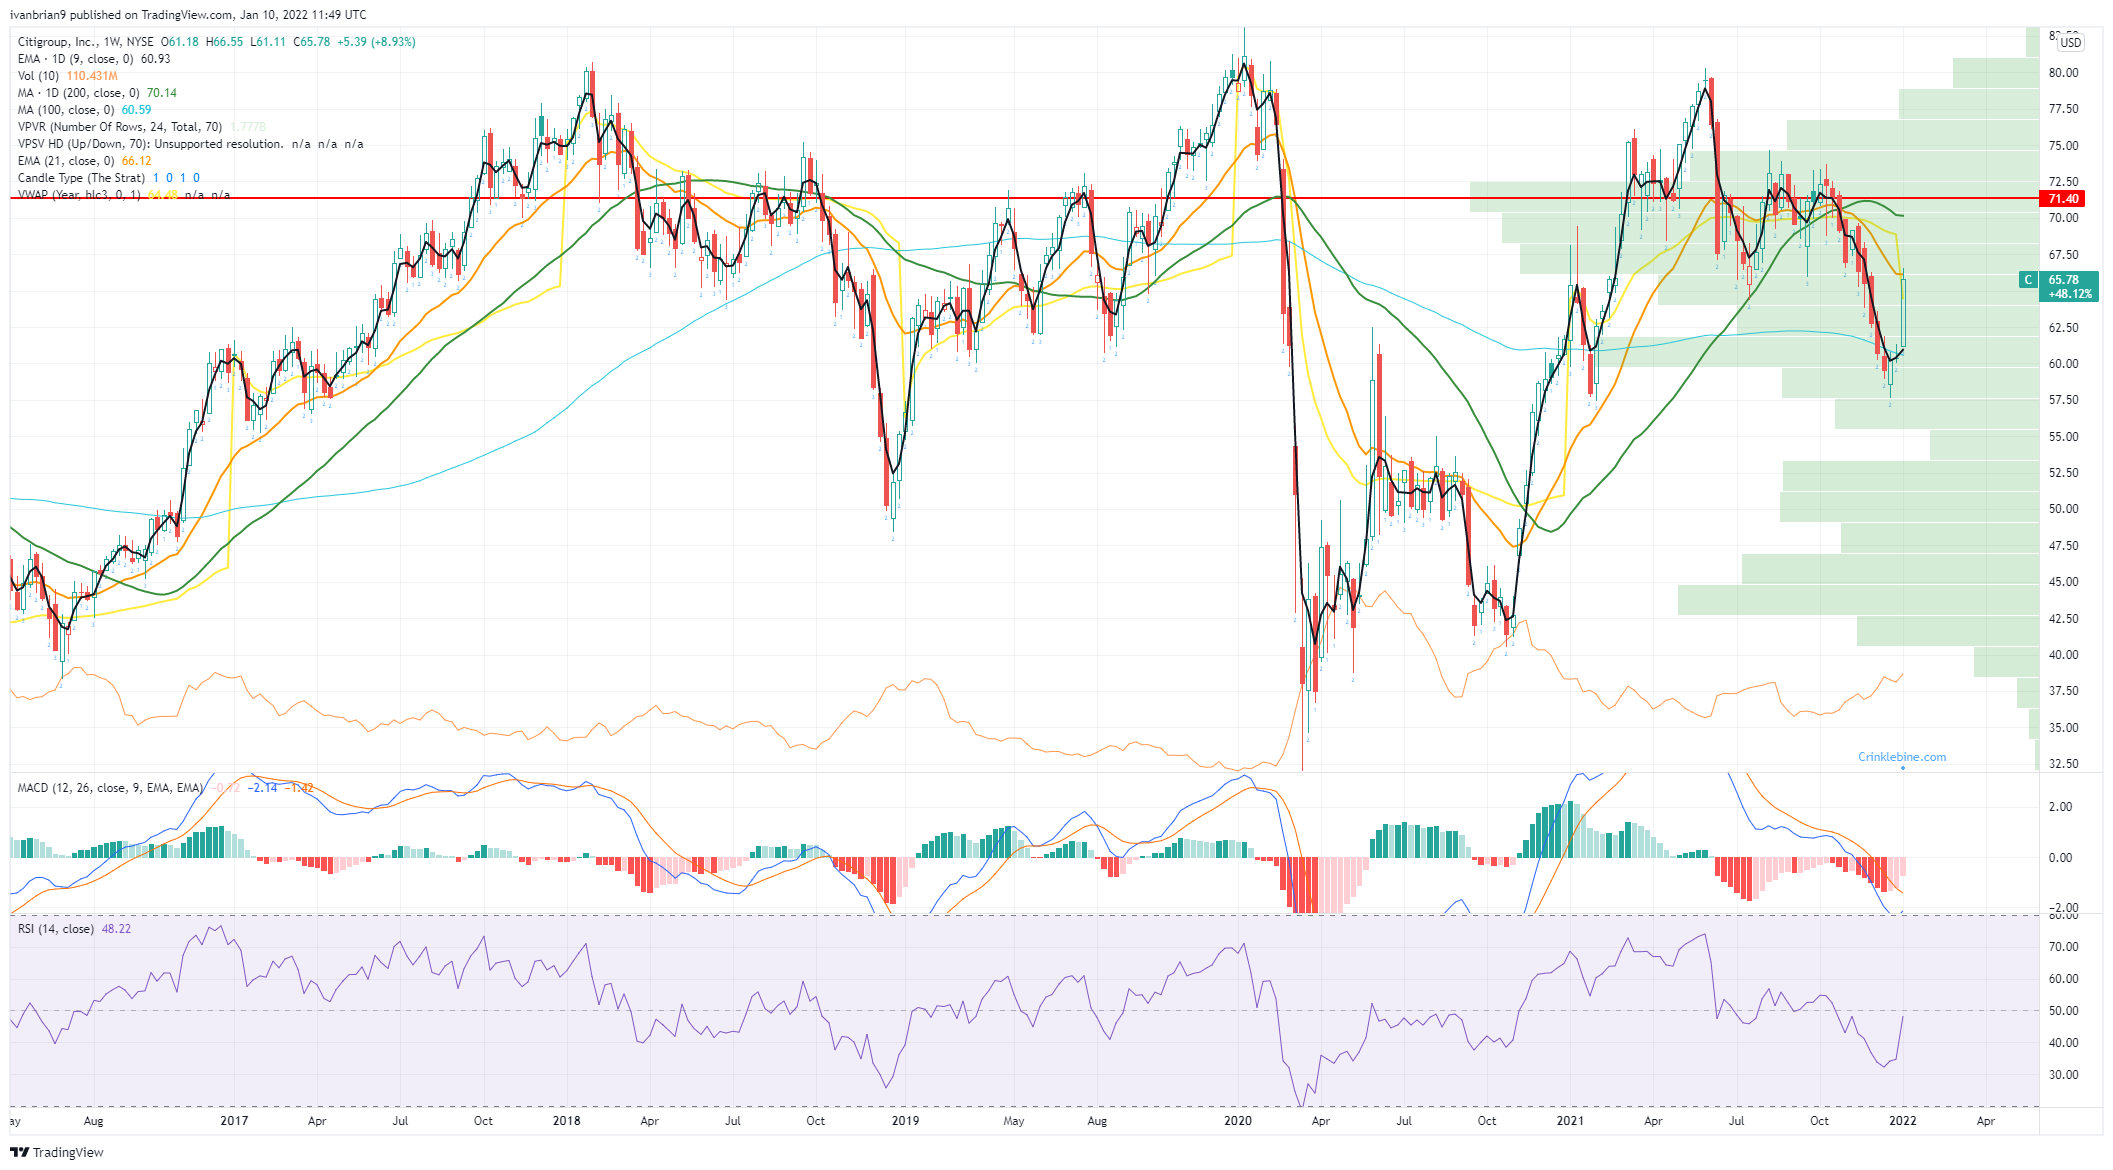
Citigroup (C) weekly chart
The daily chart shows resistance at $66.50 from the low in early November. When this level broke it signified the end of the series of higher lows and was key to the late year-end slump. Breaking above will be a powerful signal putting the 200-day next insight at $70. Expect earnings to be the catalyst.
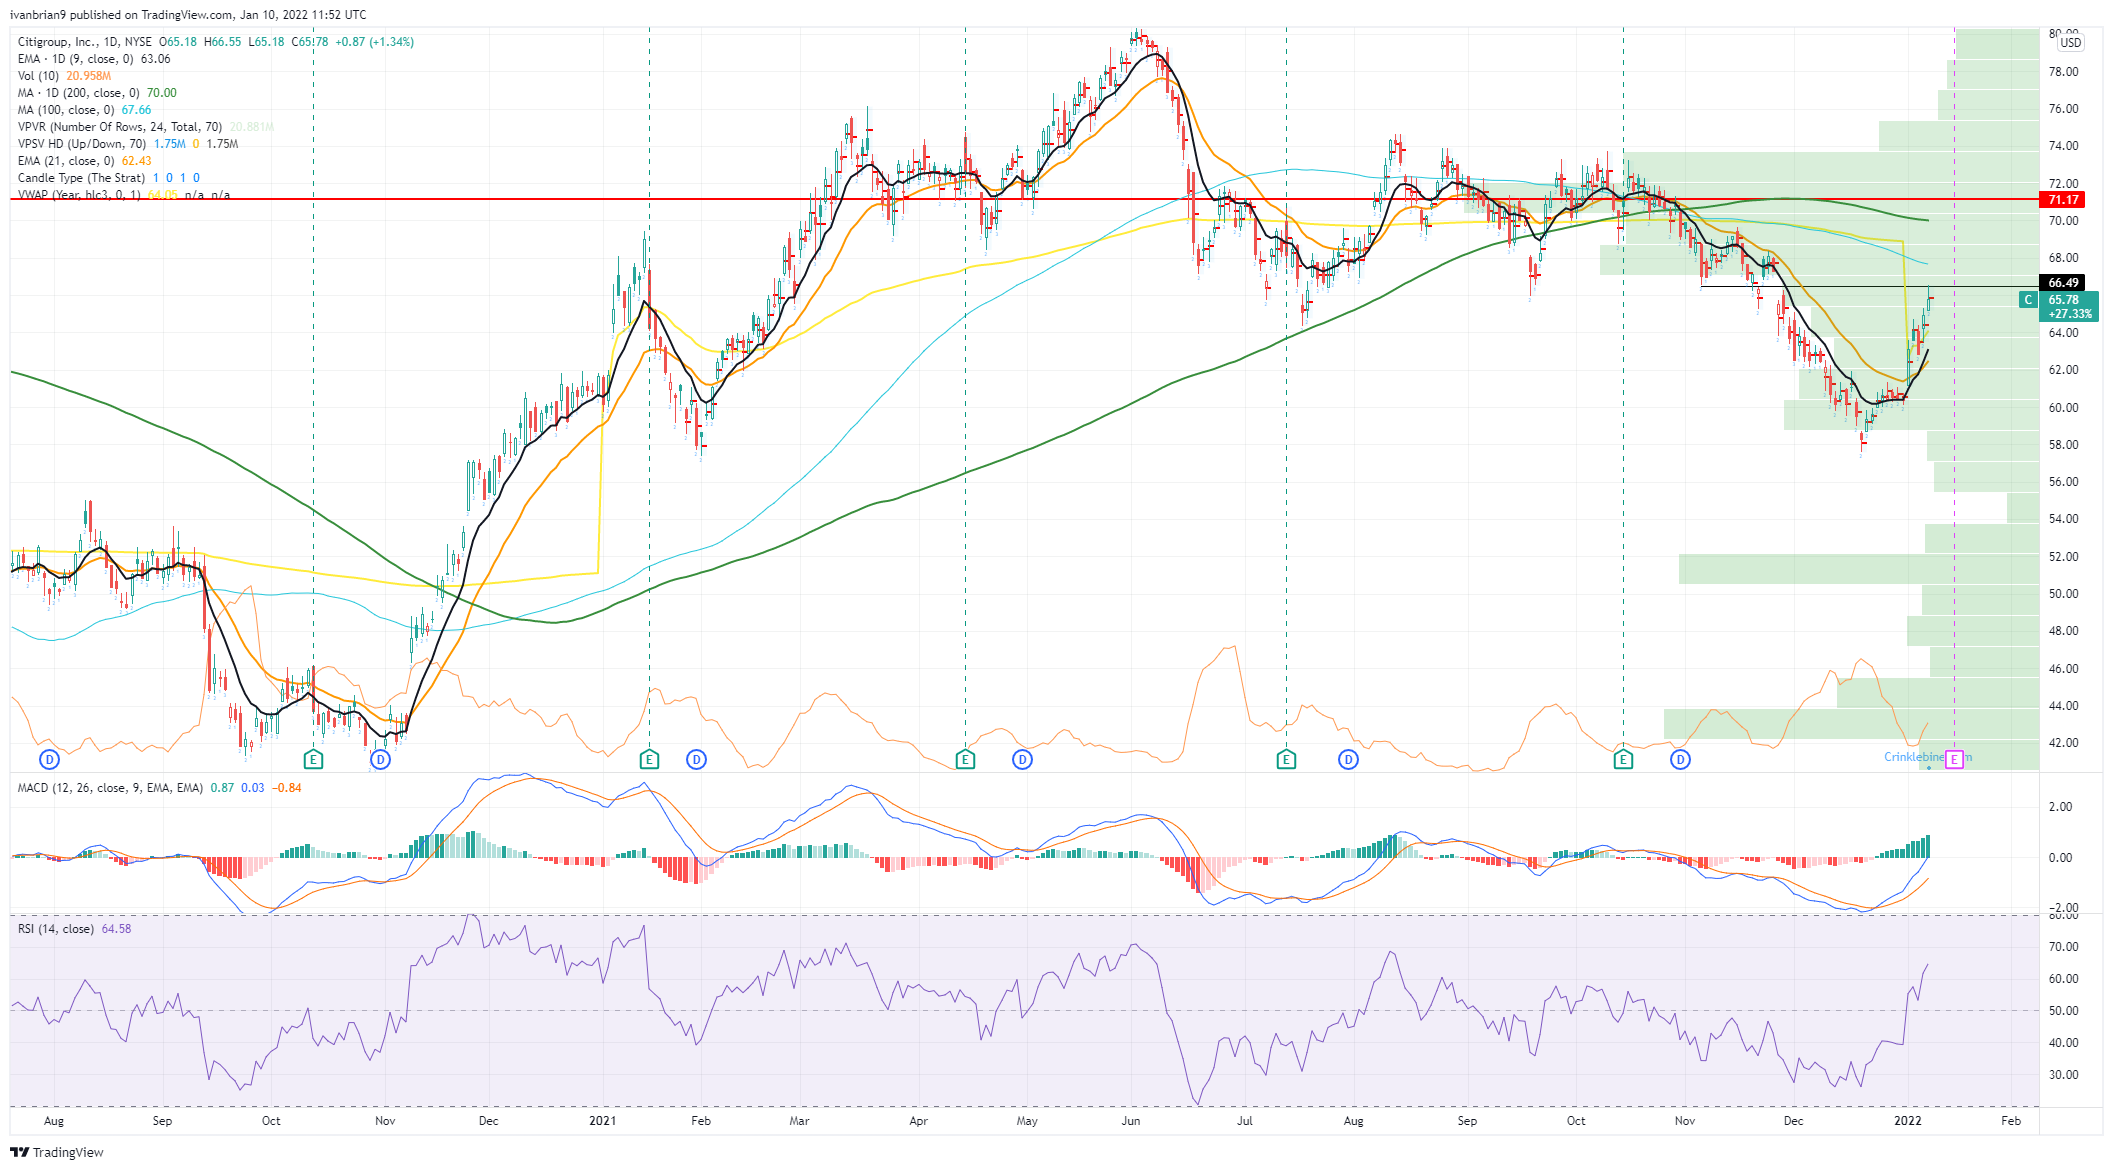
Citigroup chart, daily
Like this article? Help us with some feedback by answering this survey:
Premium
You have reached your limit of 3 free articles for this month.
Start your subscription and get access to all our original articles.
Author

Ivan Brian
FXStreet
Ivan Brian started his career with AIB Bank in corporate finance and then worked for seven years at Baxter. He started as a macro analyst before becoming Head of Research and then CFO.


