Cipla Elliott Wave technical analysis [Video]
![Cipla Elliott Wave technical analysis [Video]](https://editorial.fxstreet.com/images/Markets/Equities/Industries/Pharma/vaccine-development_XtraLarge.jpg)
Cipla Elliott Wave technical analysis
Function: Larger Degree Trend Higher (Intermediate Degree Orange).
Mode: Motive.
Structure: Impulse.
Position: Minor Wave 5 Grey.
Details: Minor Wave 5 Grey is progressing higher towards 1758, within Intermediate Wave (5) Orange against 1472.
Invalidation point: 1472.
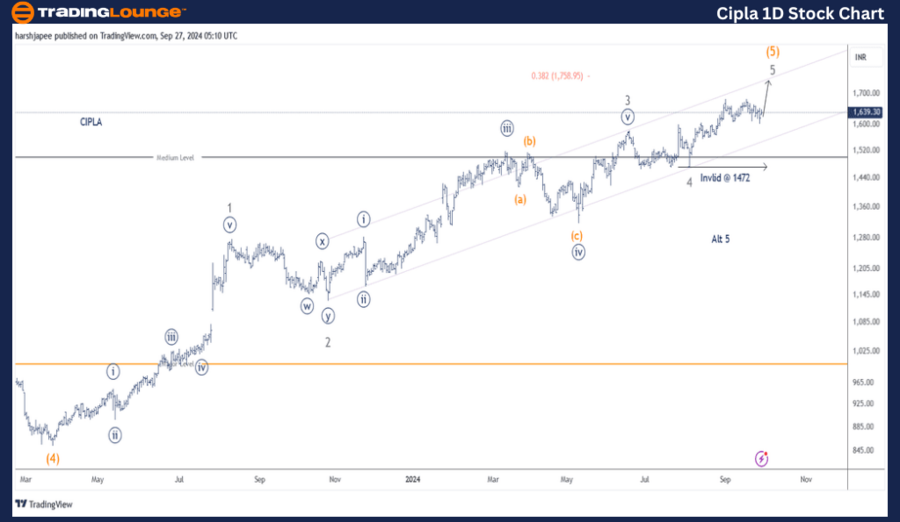
Cipla daily chart technical analysis and potential Elliott Wave counts
CIPLA daily chart is indicating a continued push higher through 1758-60 zone going forward. This would terminate Minor Wave 5 Grey of Intermediate Wave (5) Orange and complete the uptrend at larger degree. Bears are expected to be back thereafter and a break below 1470 will confirm.
CIPLA is near to completing its Intermediate Wave (5) Orange after having sub divided into five waves since its low around 850-55 registered in March 2023. Minor Waves 1 through 5 are almost complete as the final leg is underway to print around 1758 mark.
If the above holds well, the stock should ideally react around 1760 and turn lower as bears gain control back. Furthermore, a break below 1470-72, Minor Wave 4 Grey termination, would confirm the trend has turned lower.
Cipla Elliott Wave technical analysis
Function: Larger Degree Trend Higher (Intermediate Degree Orange).
Mode: Motive.
Structure: Impulse.
Position: Minor Wave 5 Grey.
Details: Minor Wave 5 Grey is progressing higher towards 1758, within Intermediate Wave (5) Orange against 1472. Minute Wave ((v)) Grey might be underway now, as bulls attempt a last rally.
Invalidation point: 1472.
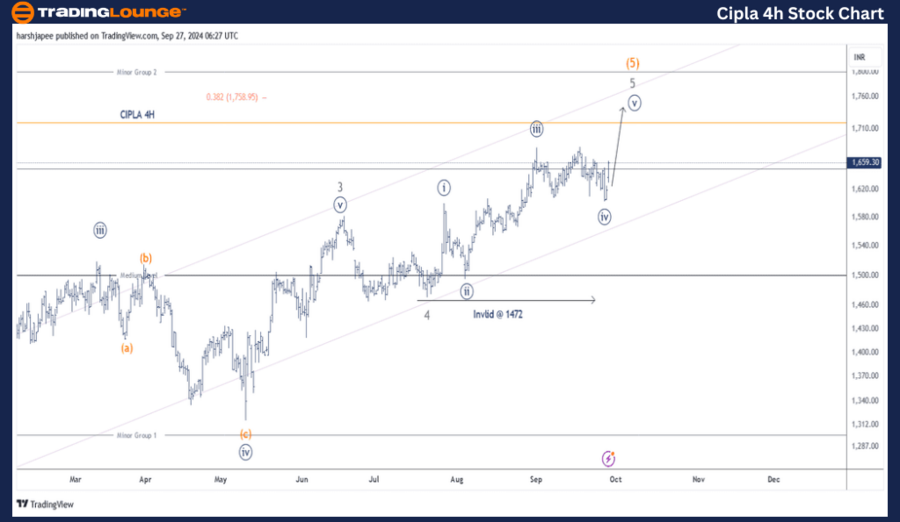
Cipla four-hour chart technical analysis and potential Elliott Wave counts
CIPLA 4H chart is also indicating that Minute Wave ((v)) Navy of Minor Wave 5 Grey within Intermediate Wave (5) Orange cold be now underway after Minute Wave ((iv)) terminated around 1600-05 range. If the above is correct, prices should raise through 1758 mark at least as projected by the fibonacci 0.618 extension here.
Conclusion
CIPLA is progressing towards 1758 as Minor Wave 5 Grey of Intermediate Wave (5) Orange prepares to terminate.
Cipla Elliott Wave technical analysis [Video]
Author

Peter Mathers
TradingLounge
Peter Mathers started actively trading in 1982. He began his career at Hoei and Shoin, a Japanese futures trading company.


