Caterpillar Inc. (CAT) Elliott Wave technical analysis [Video]
![Caterpillar Inc. (CAT) Elliott Wave technical analysis [Video]](https://editorial.fxsstatic.com/images/i/charts-01_XtraLarge.jpg)
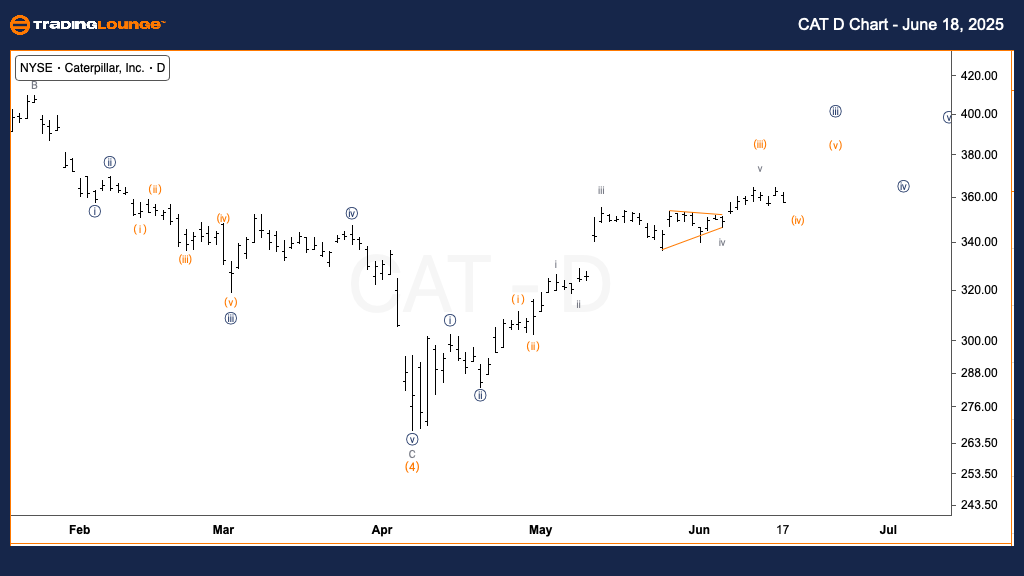
Caterpillar Inc. (CAT) – Elliott Wave analysis – Day chart
Function: Trend.
Mode: Motive.
Structure: Impulsive.
Position: Wave (iv) of {iii}.
Direction: Upside into wave (v).
Details: The corrective wave (iv) seems close to completing. The overall structure of minute wave {iii} suggests another leg up as part of wave (v). The broader trend remains upward.
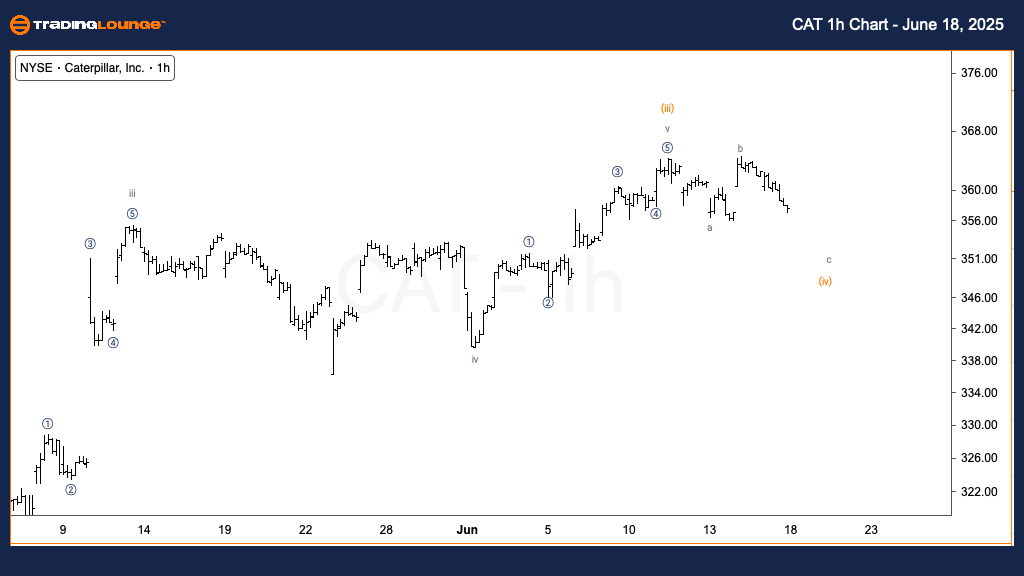
One-hour chart – Elliott Wave technical analysis
Function: Trend.
Mode: Motive.
Structure: Impulsive.
Position: Wave c of (iv).
Direction: Possible bottom in wave c.
Details: A final leg lower in wave c is expected. Potential support is near $350. A bounce from this level would confirm the end of wave (iv), setting the path toward $380, the target at MinorGroup2.
Caterpillar Inc. (CAT) Elliott Wave technical analysis [Video]
Author

Peter Mathers
TradingLounge
Peter Mathers started actively trading in 1982. He began his career at Hoei and Shoin, a Japanese futures trading company.


