Bovespa Index Elliott Wave technical analysis [Video]
![Bovespa Index Elliott Wave technical analysis [Video]](https://editorial.fxsstatic.com/images/i/stock-01_XtraLarge.jpg)
Bovespa Index Elliott Wave technical analysis – Day chart
-
Function: Bullish Trend.
-
Mode: Impulsive.
-
Structure: Gray Wave 3.
-
Position: Orange Wave 3.
-
Direction next lower degrees: Gray Wave 4.
-
Details: Gray Wave 2 appears complete; Gray Wave 3 is now active.
-
Wave cancel invalidation level: 122,486.
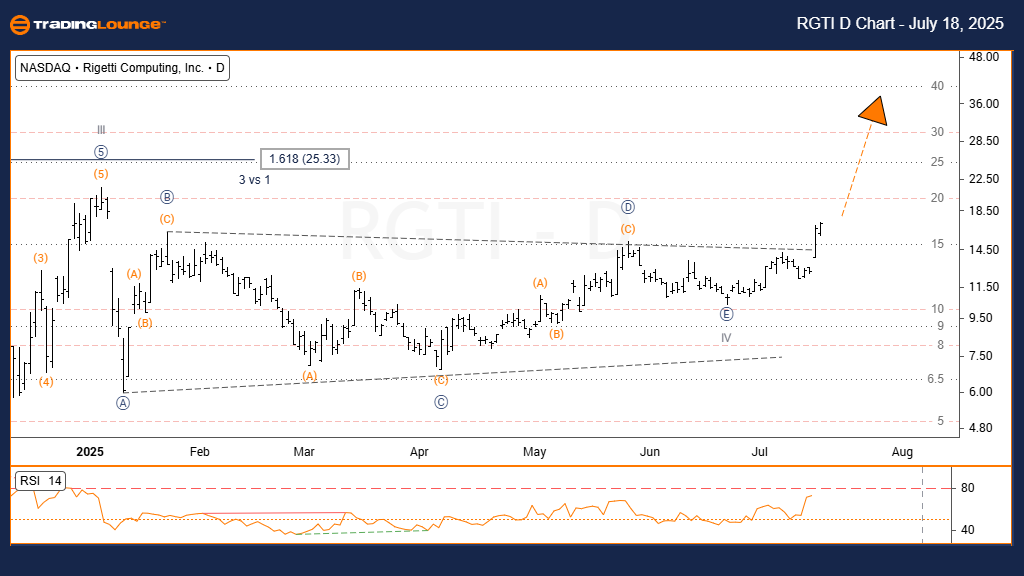
The daily chart of the Bovespa Index highlights a strong bullish trend, characterized by impulsive wave formation. The wave count indicates that Gray Wave 3 is progressing inside a larger Orange Wave 3, aligning with one of the most aggressive stages in Elliott Wave theory. With Gray Wave 2 concluded, the index has shifted into an impulse phase with strong upside potential.
This wave formation signals a transition from consolidation to a powerful trending environment. Gray Wave 3, typically known for steep momentum, confirms strong institutional buying interest. The wave invalidation level at 122,486 serves as a critical technical benchmark—if breached, it would require reassessing the bullish structure.
Gray Wave 4 is expected next as a moderate pullback before the uptrend resumes. Traders should monitor current momentum within Gray Wave 3 while using 122,486 as a key risk management level. The positioning within Orange Wave 3 further suggests continued strength ahead. This setup offers a structured way to identify trading opportunities in line with the broader bullish trend.
Bovespa Index Elliott Wave technical analysis – Weekly chart
-
Function: Bullish Trend.
-
Mode: Impulsive.
-
Structure: Orange Wave 3.
-
Position: Navy Blue Wave 1.
-
Direction next lower degrees: Orange Wave 4.
-
Details: Orange Wave 2 is complete; Orange Wave 3 is currently unfolding.
-
Wave cancel invalidation level: 122,486.
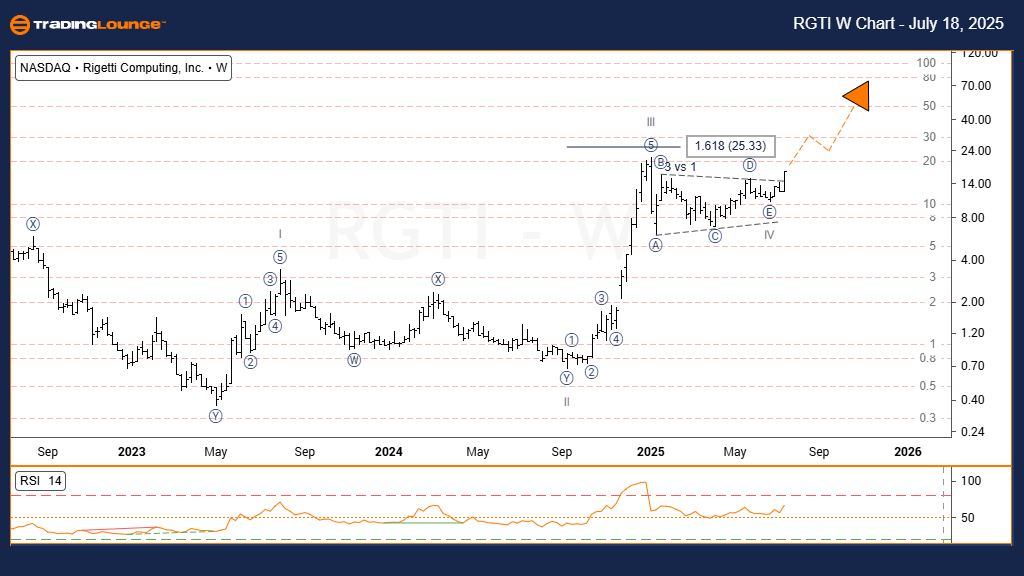
The weekly Elliott Wave chart for the Bovespa Index displays a solid bullish market condition, with clear impulsive behavior driving price action. Currently, Orange Wave 3 is forming within the broader Navy Blue Wave 1, suggesting the index is in a dynamic phase that often leads to extended gains. With Orange Wave 2 completed, the new impulse wave shows strong market momentum.
This impulsive phase is reinforced by repeated higher highs, pointing to continued institutional buying in Brazilian equities. The wave invalidation point is set at 122,486. A breach below this would nullify the bullish count and require an updated analysis.
The next likely move is Orange Wave 4, typically a shallow retracement after a powerful advance. Traders should continue observing the development of Orange Wave 3 for trend confirmation, while managing risk around the key support level. The current structure aligns with Elliott Wave’s most favorable conditions for trading, backed by a multi-timeframe bullish confirmation.
Bovespa Index Elliott Wave technical analysis [Video]
Author

Peter Mathers
TradingLounge
Peter Mathers started actively trading in 1982. He began his career at Hoei and Shoin, a Japanese futures trading company.


