|

BHP Group Limited – BHP Elliott Wave technical analysis [Video]

ASX: BHP Group Limited – BHP Elliott Wave technical analysis

Greetings, our Elliott Wave analysis today updates the Australian Stock Exchange (ASX) with BHP GROUP LIMITED – BHP. We observe upside potential in ASX:BHP, as wave 2)–orange has ended as a Zigzag, and wave 3)–orange shows room to extend. This analysis outlines the price target and what invalidates the view.

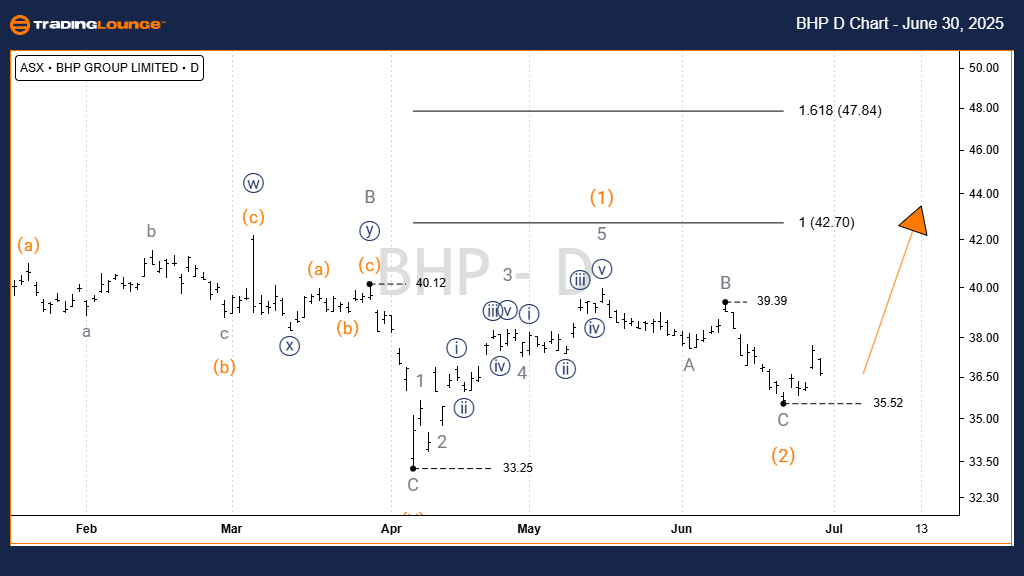
One-day chart (semilog scale) analysis

Function: Major trend (Intermediate degree, orange).

Mode: Motive.

Structure: Impulse.

Position: Wave 3)–orange.

Details:

Since the low at 33.25, wave 1)–orange completed as a five‑wave structure. Then wave 2)–orange likely finished as a three‑wave Zigzag labeled A–B–C–grey. This implies wave 3)–orange may be unfolding, targeting the 42.70–47.84 range. For this bullish view to hold, price must stay above 35.52.

Invalidation point: 35.52.

Chart

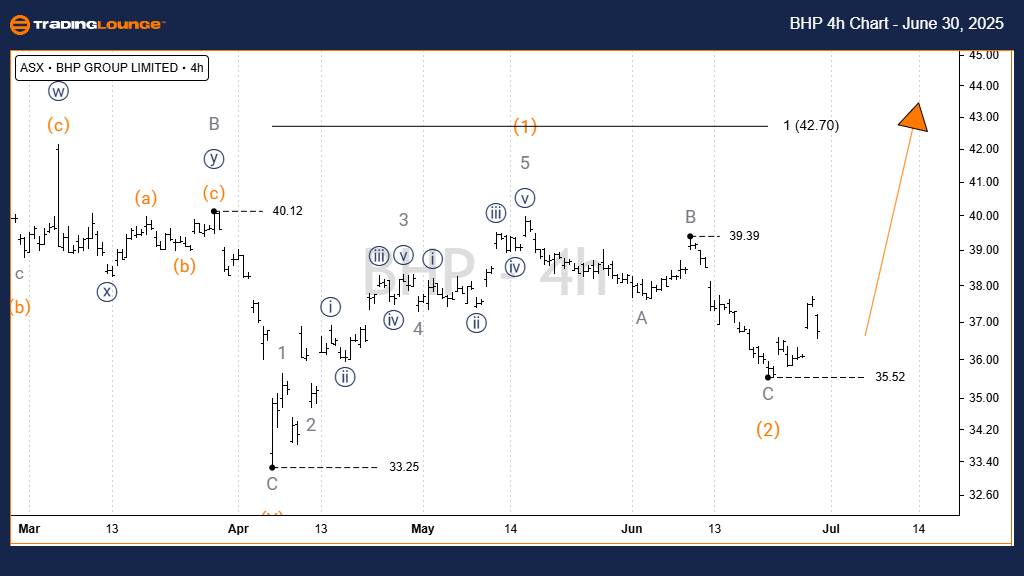
ASX: BHP Group Limited – BHP four‑hour chart analysis

Function: Major trend (Intermediate degree, orange).

Mode: Motive.

Structure: Impulse.

Position: Wave 3)–orange.

Details:
On the 4‑hour timeframe, our assessment remains unchanged from the 1‑day chart. A Long Trade setup may be triggered once price moves above the Entry level.

Invalidation point: 35.52.

Chart

Conclusion

Our Elliott Wave analysis and short‑term outlook for ASX: BHP aim to grant readers objective, professional insights. We specify price levels for confirming or invalidating our wave count, boosting confidence in our view. These data‑driven signals help traders capitalize effectively on market trends.

BHP Group Limited – BHP Elliott Wave technical analysis [Video]

Author

Peter Mathers

Peter Mathers

TradingLounge

Peter Mathers started actively trading in 1982. He began his career at Hoei and Shoin, a Japanese futures trading company.

More from Peter Mathers
Share:

Markets move fast. We move first.

Orange Juice Newsletter brings you expert driven insights - not headlines. Every day on your inbox.

By subscribing you agree to our Terms and conditions.

Editor's Picks

EUR/USD moves sideways below 1.1800 on Christmas Eve

EUR/USD struggles to find direction and trades in a narrow channel below 1.1800 after posting gains for two consecutive days. Bond and stock markets in the US will open at the usual time and close early on Christmas Eve, allowing the trading action to remain subdued. 

GBP/USD keeps range around 1.3500 amid quiet markets

GBP/USD keeps its range trade intact at around 1.3500 on Wednesday. The Pound Sterling holds the upper hand over the US Dollar amid pre-Christmas light trading as traders move to the sidelines heading into the holiday season. 

Gold retreats from record highs, trades below $4,500

Gold retreats after setting a new record-high above $4,520 earlier in the day and trades in a tight range below $4,500 as trading volumes thin out ahead of the Christmas break. The US Dollar selling bias remains unabated on the back of dovish Fed expectations, which continues to act as a tailwind for the bullion amid persistent geopolitical risks.

Bitcoin slips below $87,000 as ETF outflows intensify, whale participation declines

Bitcoin price continues to trade around $86,770 on Wednesday, after failing to break above the $90,000 resistance. US-listed spot ETFs record an outflow of $188.64 million on Tuesday, marking the fourth consecutive day of withdrawals.

Economic outlook 2026-2027 in advanced countries: Solidity test

After a year marked by global economic resilience and ending on a note of optimism, 2026 looks promising and could be a year of solid economic performance. In our baseline scenario, we expect most of the supportive factors at work in 2025 to continue to play a role in 2026.

Avalanche struggles near $12 as Grayscale files updated form for ETF

Avalanche trades close to $12 by press time on Wednesday, extending the nearly 2% drop from the previous day. Grayscale filed an updated form to convert its Avalanche-focused Trust into an ETF with the US Securities and Exchange Commission.