BABA: We continue to wait for lower prices

The BABA structure hints at a bearish corrective trend taking the form of a cycle triple zigzag w-x-y-x-z.
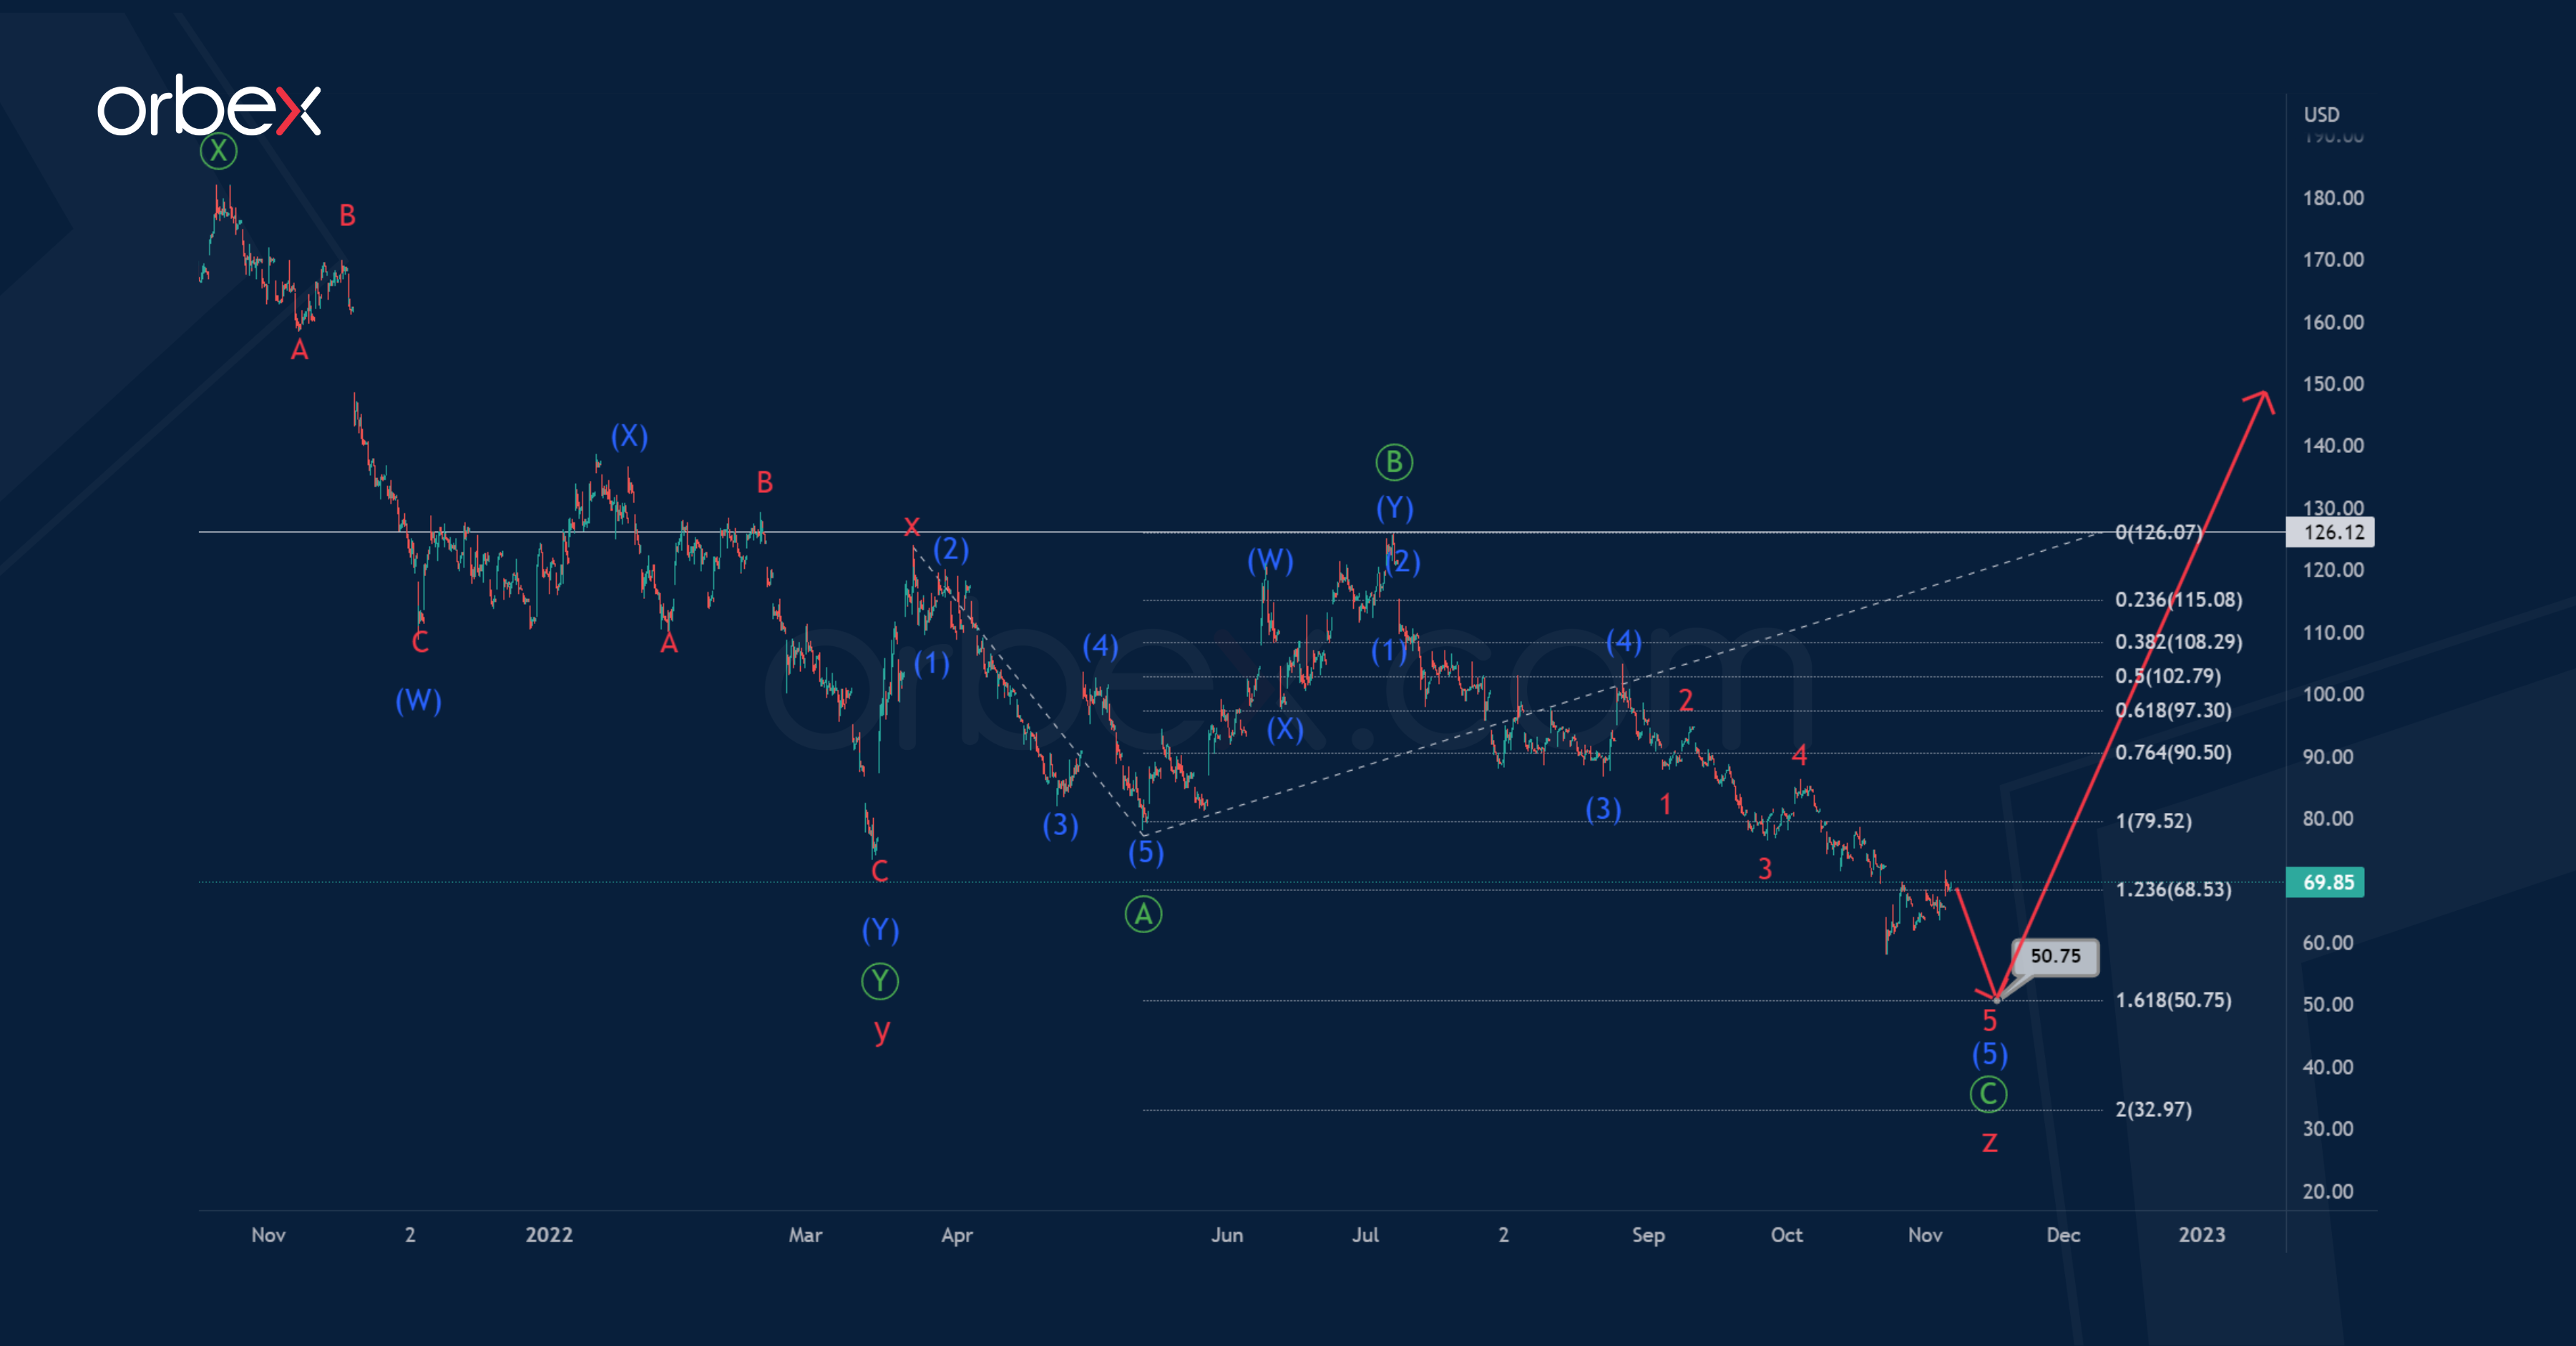
At the moment, the market is in the final part of this pattern. We see a completed actionary wave y, which has the form of a primary double zigzag Ⓦ-Ⓧ-Ⓨ, and a second small intervening wave x.
Now the formation of the final actionary wave z is taking place, which, apparently, takes the form of a primary standard zigzag Ⓐ-Ⓑ-Ⓒ, as shown in the chart.
The primary wave Ⓐ has the form of an impulse (1)-(2)-(3)-(4)-(5), and the correction Ⓑ takes the form of an intermediate double zigzag (W)-(X)-(Y). In the near future, stocks may continue to fall in the primary wave Ⓒ in the form of impulse (1)-(2)-(3)-(4)-(5) to 50.75. At that level, primary impulse wave Ⓒ will be at 161.8% of impulse Ⓐ.
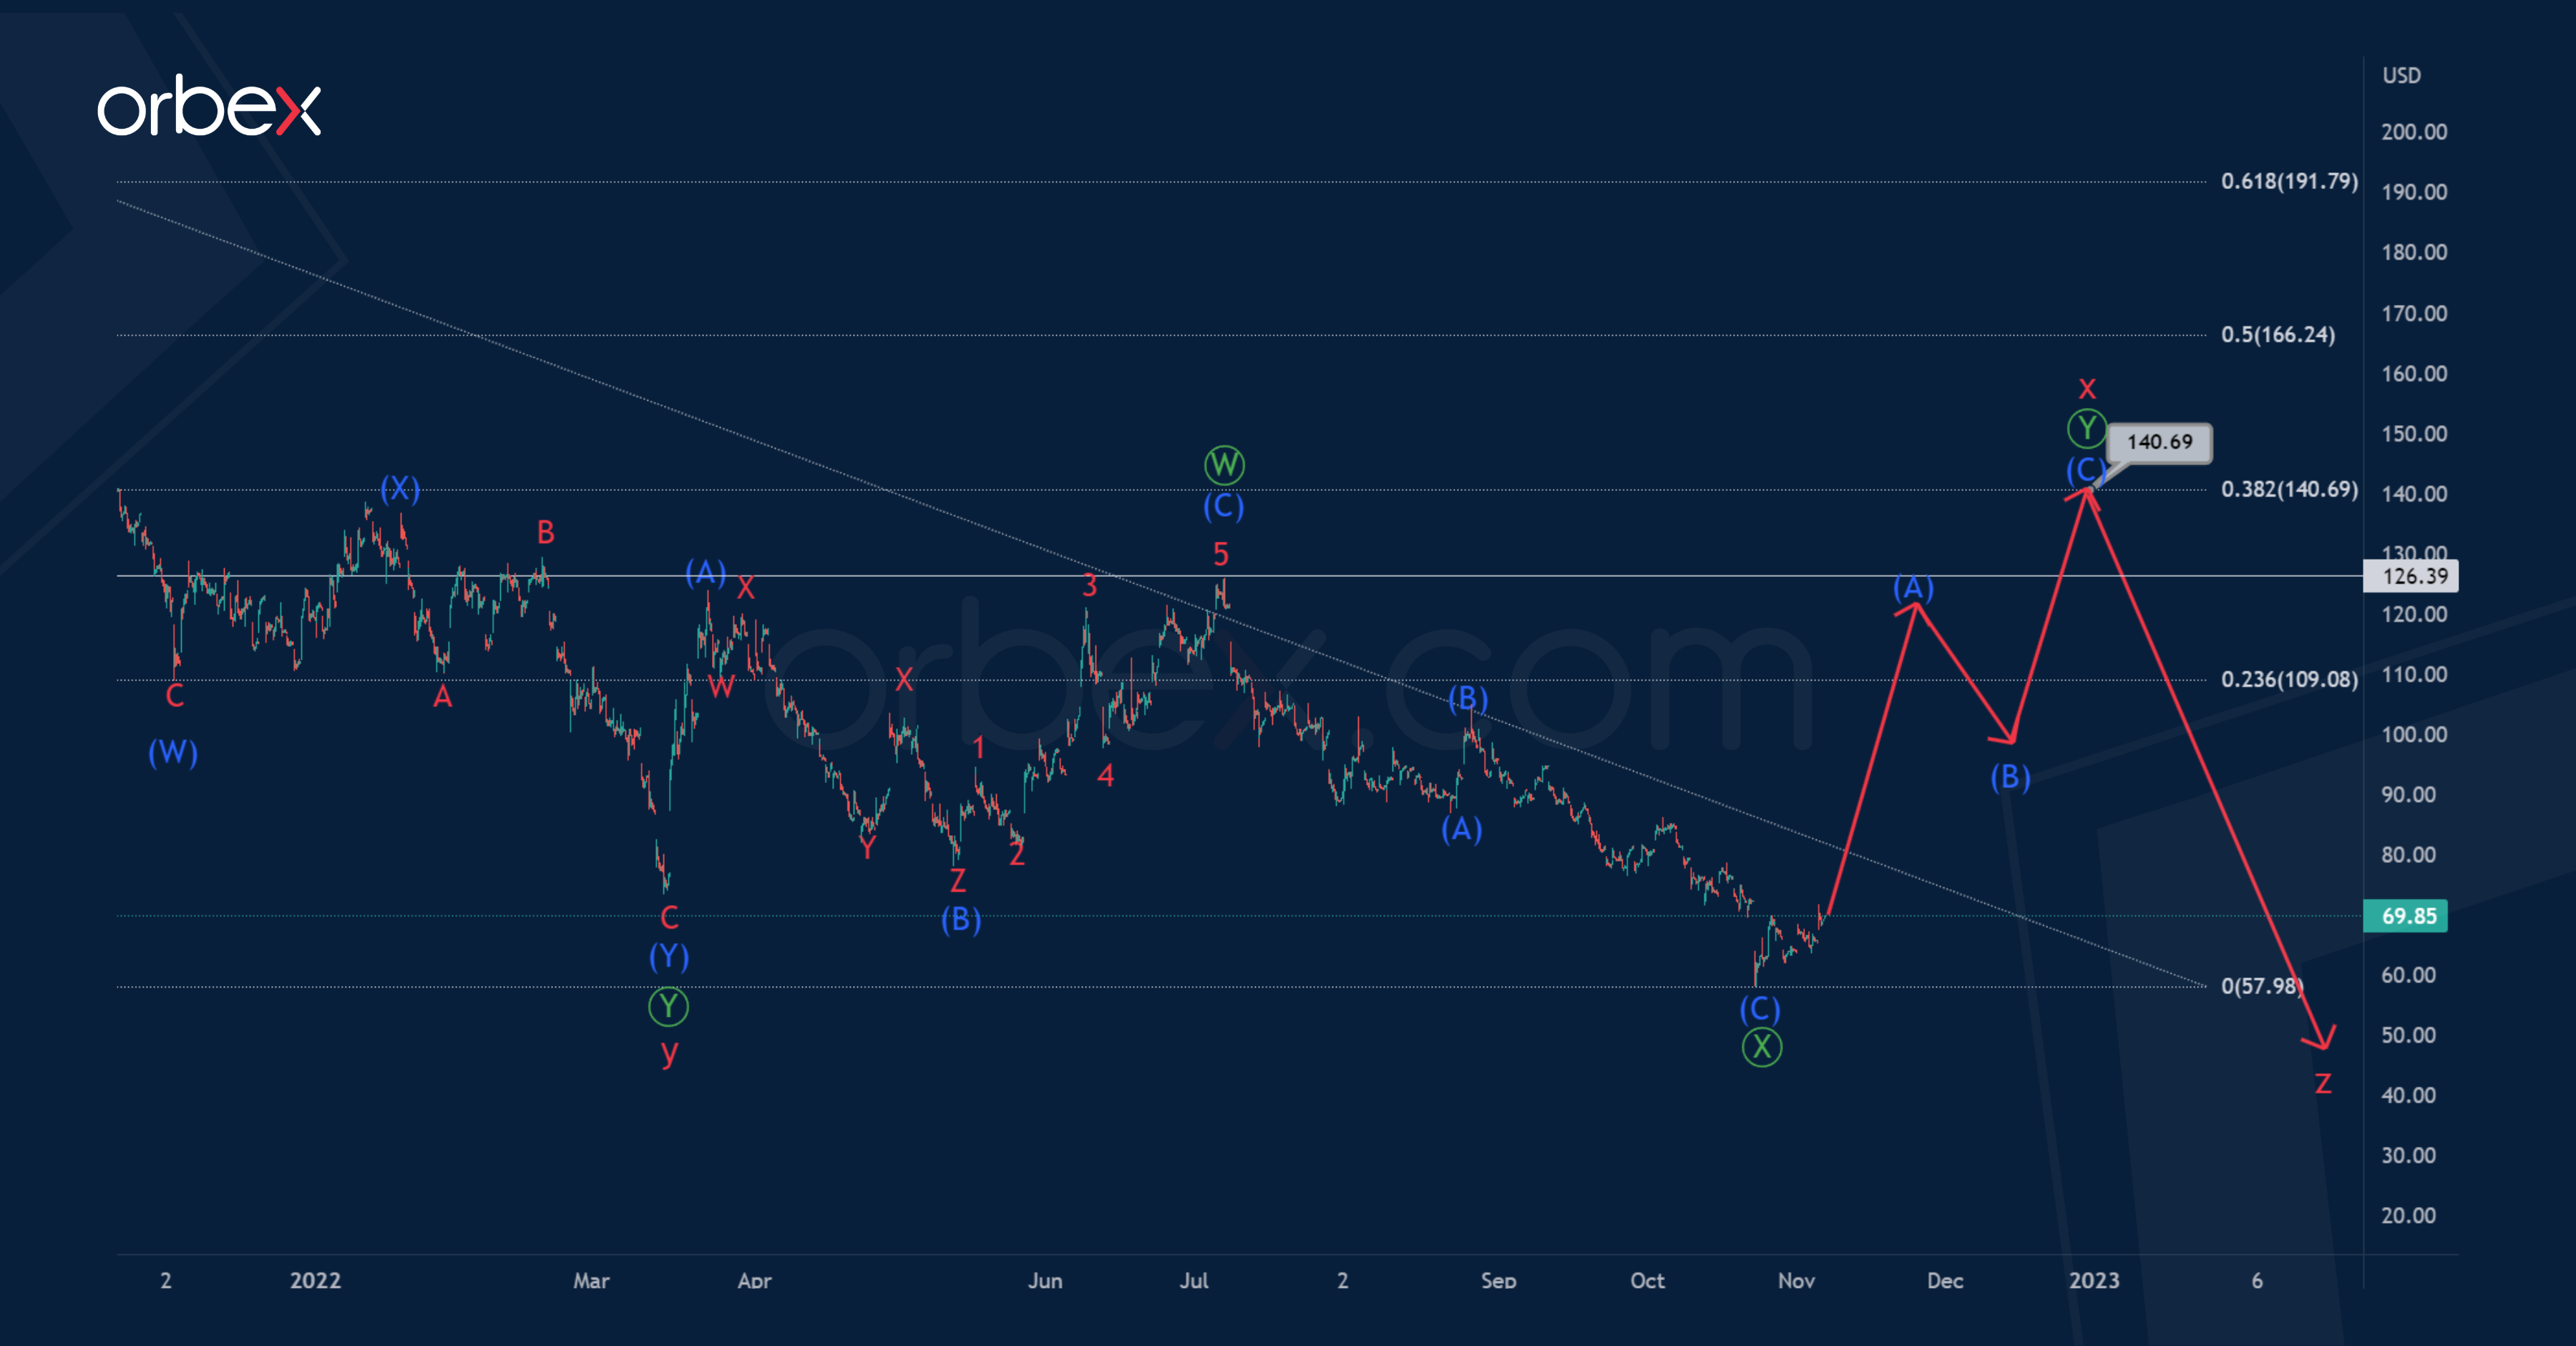
The second chart hints that the formation of the cycle intervening wave x continues. Here it will take the form of a double zigzag Ⓦ-Ⓧ-Ⓨ of the primary degree. The first two zigzag sub-waves Ⓦ-Ⓧ look finished.
Now the price is in the wave Ⓨ. It is assumed that this wave will take a standard zigzag structure (A)-(B)-(C), as shown in the chart.
The growth of the shares should be expected to 149.02. At that level, cycle intervening wave x will be at 38.2% of actionary wave y. The nearest target for opening long positions is a maximum of 126.39, where the end of the first intermediate impulse (A) is expected.
Author

Jing Ren
Orbex
Jing-Ren has extensive experience in currency and commodities trading. He began his career in metal sales and trading at Societe Generale in London.


