|

AUDUSD Price Analysis: 0.6900 looks possible as Aussie bulls are in action

  • AUDUSD remains lackluster following the footprints of the DXY.
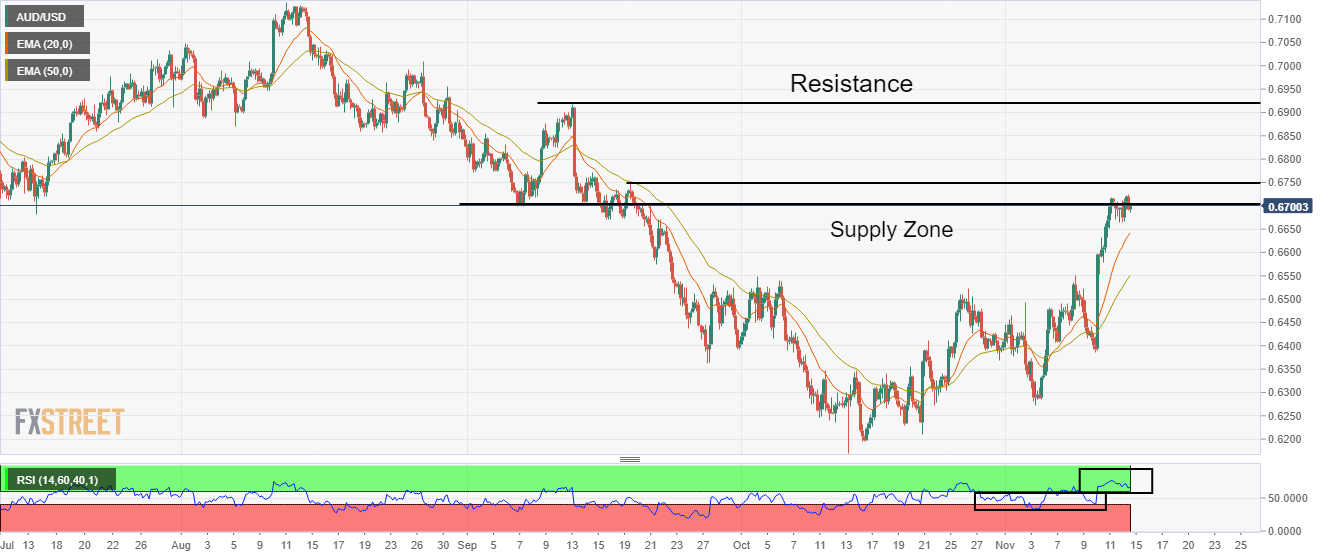
  • Bulls are hopeful of a break above the supply zone placed in a 0.6702-0.6751.
  • Advancing 20-and 50-EMAs add to the upside filters.

The AUDUSD pair is displaying a lackluster performance in the Asian session despite the release of the Reserve Bank of Australia (RBA) monetary policy minutes to provide detailed reasoning behind hiking interest rates by 25 basis points (bps) in November’s monetary policy meeting.

Also, the US dollar index (DXY) is witnessing back-and-forth moves amid a quiet market mood. The DXY is struggling to surpass the immediate hurdle of 107.00. A minor recovery in the 10-year US Treasury yields to 3.88% has been recorded.

On a four-hour scale, the asset is struggling to cross the demand zone placed in a narrow range of 0.6702-0.6751. The 20-and 50-period Exponential Moving Averages (EMAs) at 0.6642 and 0.6550 respectively are sloping north, which adds to the upside filters.

Meanwhile, the Relative Strength Index (RSI) (14) has shifted into the bullish range of 60.00-80.00, which indicates more weakness ahead.

Should the asset overstep the above-mentioned demand zone decisively, room for extra gains will get uncovered. The pair will march towards September 2 high at 0.6814, followed by the critical resistance placed from September 13 high around 0.6900.

On the flip side, the greenback bulls will regain strength if the asset drops below Thursday’s low at 0.6387. This will drag the pair towards October 14 high at 0.6324 and November 3 low at 0.6272.

AUDUSD four-hour chart

.

AUD/USD

Overview
Today last price
0.67
Today Daily Change
0.0000
Today Daily Change %
0.00
Today daily open
0.67
 
Trends
Daily SMA20
0.6432
Daily SMA50
0.65
Daily SMA100
0.6702
Daily SMA200
0.6956
 
Levels
Previous Daily High
0.6724
Previous Daily Low
0.6664
Previous Weekly High
0.6717
Previous Weekly Low
0.6387
Previous Monthly High
0.6548
Previous Monthly Low
0.617
Daily Fibonacci 38.2%
0.6686
Daily Fibonacci 61.8%
0.6701
Daily Pivot Point S1
0.6668
Daily Pivot Point S2
0.6636
Daily Pivot Point S3
0.6608
Daily Pivot Point R1
0.6728
Daily Pivot Point R2
0.6756
Daily Pivot Point R3
0.6788

Author

Sagar Dua

Sagar Dua

FXStreet

Sagar Dua is associated with the financial markets from his college days. Along with pursuing post-graduation in Commerce in 2014, he started his markets training with chart analysis.

More from Sagar Dua
Share:

Editor's Picks

EUR/USD keeps its focus on 1.1800

EUR/USD is holding its ground near two-day highs around 1.1750 as Thursday’s session is drawing to a close. The pair is drawing support from a more constructive risk mood, helped by easing EU–US trade tensions and a softer US Dollar. Looking ahead, attention shifts to Friday’s flash PMI releases from both Europe and the US.

GBP/USD flirts with 1.3500 on persistent USD selling

GBP/USD is regaining momentum on Thursday and pushing up towards two-week highs around the 1.3500 mark. In the process, Cable is leaving Wednesday’s brief wobble behind and slipping back into its upward trend, helped by ongoing selling pressure on the Greenback ahead of key advanced PMI data on Friday.

Gold: The $5,000 mark is just around the corner

Gold extends its impresive rally for yet another day on Thursday, this time surpassing the $4,900 mark per troy ounce to hit record highs on the back of the marked pullback in the US Dollar. The move is unfolding even as global risk appetite improves, after Donald Trump reversed course on Greenland, a shift that has helped cool broader geopolitical tensions.

Chainlink Price Forecast: LINK vulnerable to deeper losses amid waning retail demand, staking outflows

Chainlink (LINK) is trading under pressure at $12.20, reflecting heightened volatility in the broader cryptocurrency market at the time of writing on Thursday. The oracle token faces deepening bearish pressure as technical indicators deteriorate and market sentiment weakens.

Trump walks back NATO tariffs, signals de-escalation

What began as a sharp escalation risk quickly turned into a de-escalation signal. Earlier this week, markets briefly priced in escalation risk after Donald J. Trump proposed a 10% tariff hike on eight NATO nations amid the Greenland dispute.

XRP defends $1.90 support as ETFs attract inflows despite retail caution

Ripple (XRP) is consolidating above $1.90, a short-term support level, at the time of writing on Thursday. This mild uptick marks two consecutive days of a strengthening technical outlook, following recent market-wide volatility.