|

AUD/USD price Analysis: Volatility contracts amid Descending Triangle formation

  • AUD/USD jumps to near 0.6650 ahead of US core PCE Inflation data.
  • The US Dollar weakens as a downwardly revised Q1 GDP keeps hopes of the Fed cutting rates at least once this year on the table.
  • Australia’s hot CPI report for April pushes back RBA’s rate-cut prospects.

The AUD/USD pair climbs to near 0.6650 in Friday’s London session. The Aussie asset strengthens as the US Dollar weakens ahead of United States core Personal Consumption Expenditure Price Index (PCE) data for April, which will be published at 12:30 GMT.

The US core PCE Inflation will provide cues about when the Federal Reserve (Fed) will start reducing interest rates. Currently, financial markets are mixed about September’s policy meeting.

Economists expect that core PCE inflation rose steadily by 0.3% and 2.8% monthly and annually, respectively.

The US Dollar Index (DXY) seems vulnerable near day’s low around 104.65. The near-term outlook of the US Dollar turned uncertain after US Bureau of Economic Analysis (BEA) reported its second estimates report for Q1 Gross Domestic Product (GDP) that the economy expanded at a slower pace of 1.3% due to lower consumer spendings from the preliminary estimates of 1.6%.

Meanwhile, the Australian Dollar’s appeal is upbeat as hot monthly Consumer Price Index (CPI) data for April has forced traders to pare Reserve Bank of Australia’s (RBA) early rate-cut bets. Annually, price pressures rose at a higher pace of 3.6% than estimates of 3.5% and the former reading of 3.4%.

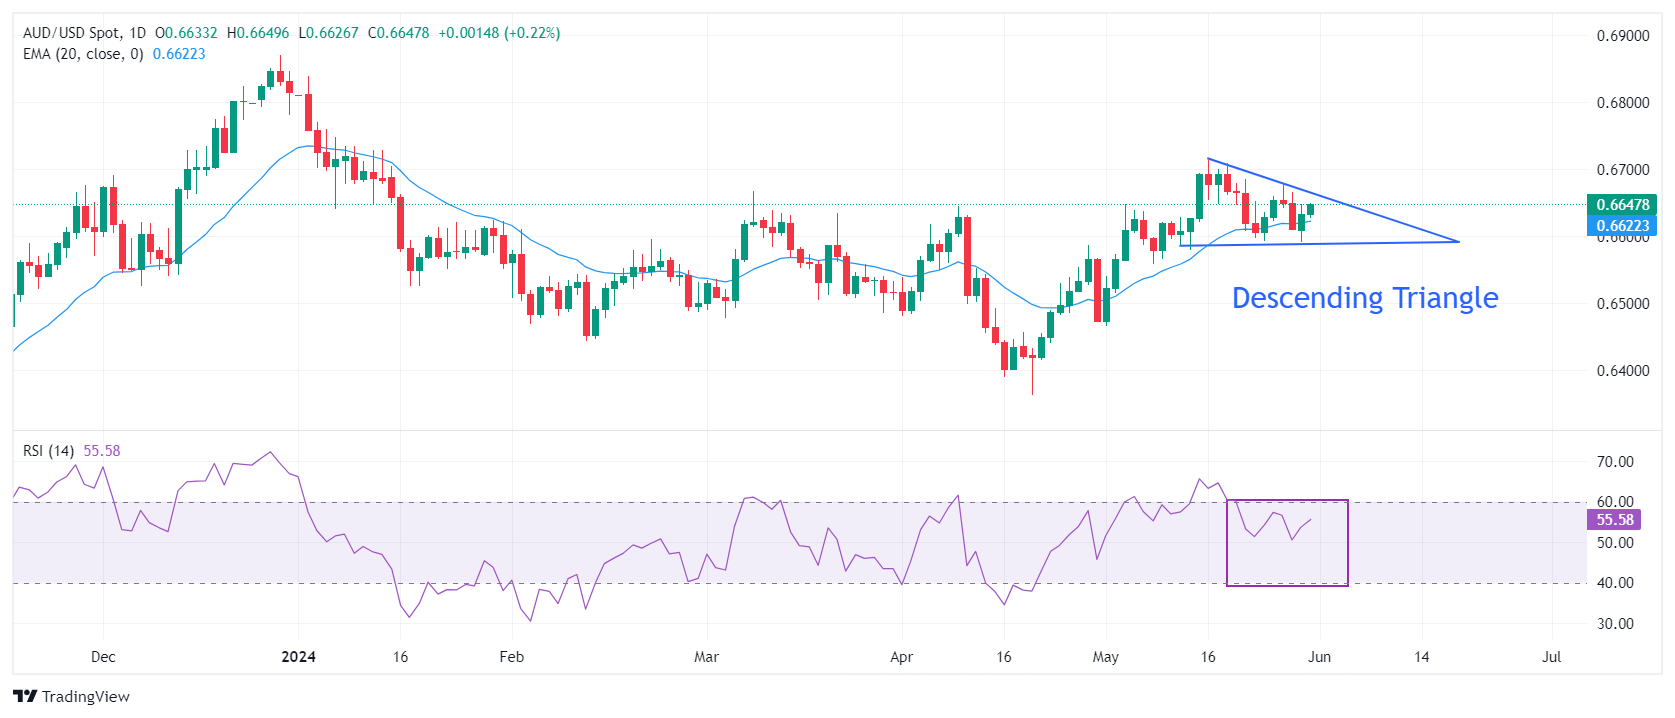
AUD/USD advances toward the downward-sloping border of the Descending Triangle chart pattern, which is plotted from May 16 high at 0.6714, formed on a daily timeframe. The horizontal support of the above-mentioned chart formation is marked from May 13 low at 0.6586.

Upward-sloping 20-day Exponential Moving Average (EMA) near 0.6620 suggests that the near-term trend is bullish.

The 14-period Relative Strength Index (RSI) oscillates in the 40.00-60.00 range, indicating a sharp volatility contraction.

Going forward, a decisive move above May’s high at 0.6714 will drive the asset towards January 3 high at 0.6771 and the round-level resistance of 0.6800.

Alternatively, a downside move would appear if the major breaks below May 14 low at 0.6580, which will expose it to May 1 high at 0.6540, followed by the psychological support of 0.6500.

AUD/USD daily chart

AUD/USD

Overview
Today last price0.6647
Today Daily Change0.0014
Today Daily Change %0.21
Today daily open0.6633
 
Trends
Daily SMA200.6633
Daily SMA500.6561
Daily SMA1000.6559
Daily SMA2000.6535
 
Levels
Previous Daily High0.6647
Previous Daily Low0.6591
Previous Weekly High0.6709
Previous Weekly Low0.6592
Previous Monthly High0.6644
Previous Monthly Low0.6362
Daily Fibonacci 38.2%0.6626
Daily Fibonacci 61.8%0.6612
Daily Pivot Point S10.66
Daily Pivot Point S20.6567
Daily Pivot Point S30.6543
Daily Pivot Point R10.6657
Daily Pivot Point R20.668
Daily Pivot Point R30.6713

Author

Sagar Dua

Sagar Dua

FXStreet

Sagar Dua is associated with the financial markets from his college days. Along with pursuing post-graduation in Commerce in 2014, he started his markets training with chart analysis.

More from Sagar Dua
Share:

Markets move fast. We move first.

Orange Juice Newsletter brings you expert driven insights - not headlines. Every day on your inbox.

By subscribing you agree to our Terms and conditions.

Editor's Picks

EUR/USD flat lines near 1.1750 ahead of ECB policy decision

EUR/USD remains flat after two down days, trading around 1.1750 in the European session on Thursday. Traders move to the sidelines and refrain from placing any fresh directional bets on the pair ahead of the ECB policy announcements and the US CPI inflation data. 

GBP/USD stays defensive below 1.3400, awaits BoE and US CPI

GBP/USD oscillates in a narrow band below 1.3400 in European trading on Thursday. The pair trades with caution as markets eagerly await the BoE policy verdict and US consumer inflation data for fresh directional impetus. 

Gold awaits weekly trading range breakout ahead of US CPI report

Gold struggles to capitalize on the previous day's move higher back closer to the $4,350 level and trades with a mild negative bias during the Asian session on Thursday. The downtick could be attributed to some profit-taking amid a US Dollar uptick, though it is likely to remain cushioned on the back of a supportive fundamental backdrop. 

Dogecoin breaks key support amid declining investor confidence

Dogecoin trades in the red on Thursday, following a 4% decline on the previous day. The DOGE supply in profit declines as large wallet investors trim their portfolios. Derivatives data shows a surge in bearish positions amid declining retail interest.

Monetary policy: Three central banks, three decisions, the same caution

While the Fed eased its monetary policy on 10 December for the third consecutive FOMC meeting, without making any guarantees about future action, the BoE, the ECB and the BoJ are holding their respective meetings this week. 

Dogecoin Price Forecast: DOGE breaks key support amid declining investor confidence

Dogecoin (DOGE) trades in the red on Thursday, following a 4% decline on the previous day. The DOGE supply in profit declines as large wallet investors trim their portfolios. Derivatives data shows a surge in bearish positions amid declining retail interest.