|

AUD/USD Price Analysis: Reversal lacks strength as risk appetite looks fragile

  • AUD/USD is facing hurdles in stretching its recovery above 0.6750 despite upbeat Australian Retail Sales data.
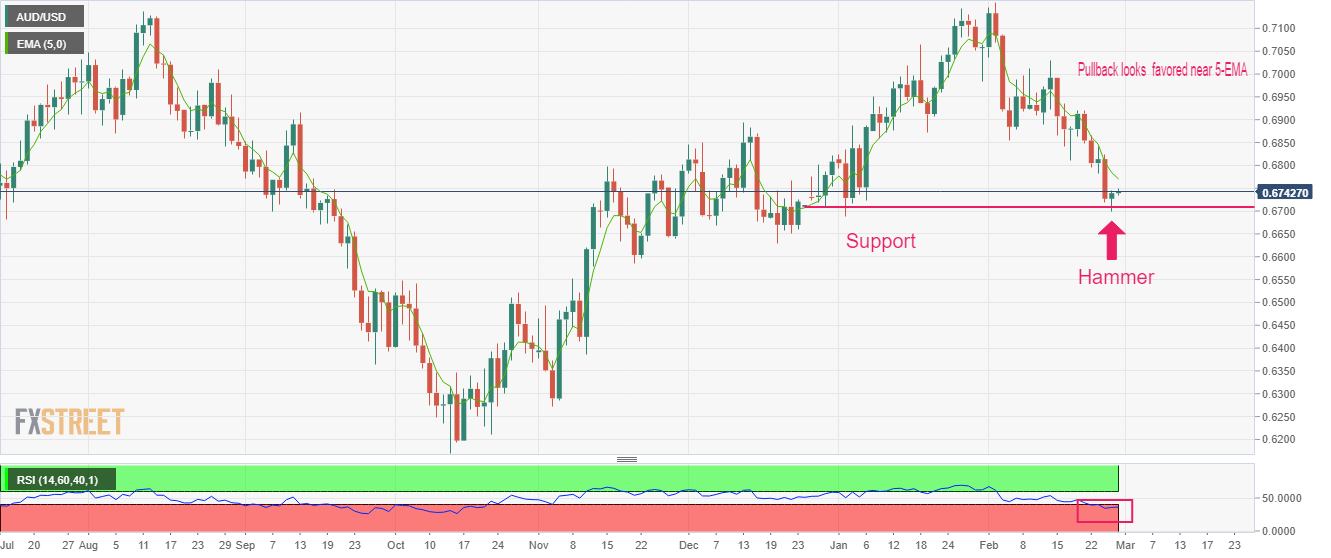
  • The Aussie has formed a Hammer candlestick pattern near the crucial support plotted near 0.6710.
  • A pullback move to near five-period EMA cannot be ruled out.

The AUD/USD pair is struggling to stretch its recovery above the 0.6750 resistance in the Asian session. A recovery move in the Aussie asset from the round-level support of 0.6700 lacks strength as the risk-off mood has not disappeared yet. The US Dollar Index (DXY) has attempted a recovery after building a cushion around 104.30. However, a sideways performance is widely anticipated after a vertical downside move and ahead of the release of the United States ISM Manufacturing PMI data.

S&P500 futures have added more gains after registering a modest recovery on Monday. The 10-year US Treasury yields are struggling to sustain gains above 3.92%.

The Australian Dollar has failed to find significant bids despite the release of the upbeat monthly Retail Sales (Jan) data. The Australian Bureau of Statistics reported the monthly economic data at 1.9%, higher than the consensus of 1.5%. In December, Retail Sales contracted by 3.9%.

AUD/USD has formed a Hammer candlestick pattern near the crucial support plotted from December 29 low at 0.6710. The formation of Hammer candlestick indicates an emergence of responsive buyers as they consider the asset a ‘value buy’ now after a sheer downside.

It is worth noting that the asset has diverged extremely from the five-period Exponential Moving Average (EMA) at 0.6768. Extremely shorter-term EMAs usually remain sticky with each other. A case of divergence results in a reversion of prices towards the EMA. Therefore, a pullback move cannot be ruled out.

The Relative Strength Index (RSI) (14) has slipped into the bearish range of 20.00-40.00, which favors a downside momentum.

Should the Aussie asset break below Monday’s low around 0.6700, US Dollar bulls will drag the asset towards December 7 low at 0.6668 followed by December 20 low at 0.6629.

On the contrary, a break above February 23 high at 0.6842 will drive the asset toward February 21 high at 0.6920. A break above the latter will expose the major for more upside towards the psychological resistance at 0.7000.

AUD/USD daily chart

AUD/USD

Overview
Today last price0.6743
Today Daily Change0.0004
Today Daily Change %0.06
Today daily open0.6739
 
Trends
Daily SMA200.6914
Daily SMA500.6894
Daily SMA1000.673
Daily SMA2000.6799
 
Levels
Previous Daily High0.6745
Previous Daily Low0.6698
Previous Weekly High0.6921
Previous Weekly Low0.6719
Previous Monthly High0.7143
Previous Monthly Low0.6688
Daily Fibonacci 38.2%0.6727
Daily Fibonacci 61.8%0.6716
Daily Pivot Point S10.671
Daily Pivot Point S20.6681
Daily Pivot Point S30.6663
Daily Pivot Point R10.6757
Daily Pivot Point R20.6774
Daily Pivot Point R30.6803

Author

Sagar Dua

Sagar Dua

FXStreet

Sagar Dua is associated with the financial markets from his college days. Along with pursuing post-graduation in Commerce in 2014, he started his markets training with chart analysis.

More from Sagar Dua
Share:

Editor's Picks

GBP/USD surges to multi-day peaks past 1.3250

GBP/USD leaves behind Friday’s small pullback and advances past 1.3250 level, or five-day highs, on Monday. Cable’s upside follows extra losses in the Greenback, while traders continue to assess the geopolitical front and upcoming key events.

EUR/USD picks up extra pace north of 1.1400

EUR/USD extends its recovery past 1.1400 the figure as the NA session draws to a close on Monday. Indeed, the pair advances for the third straight day amid the persistent offered bias in the US Dollar. Meanwhile, market participants keep gearing up for the ECB Forum in Sintra and the release of critical US labour market data.

Gold struggles to attract investors

Gold remains under marked selling pressure, holding on just above the key $4,000 mark per troy ounce at the beginning of the week. The precious metal reverses two daily advances in a row as renewed effervescence in the Middle East revive inflation concerns and bolster Fed rate hike expectations.

Strategy unveils plan allowing Bitcoin sales to fund stock buybacks, dividends and reserves
Strategy (MSTR) has unveiled a Digital Credit Framework to strengthen the company’s financial standing. Under the new framework, the world’s largest corporate holder of Bitcoin (BTC) will pivot from its previous accumulation strategy, opting to sell BTC in order to boost liquidity, fund dividend payments, execute stock buybacks, and strengthen cash reserves.
Just like Fed, is BoJ’s independence under threat?

When talking about central bank independence, most of the focus has been on Donald Trump’s pressure on the Federal Reserve. But a similar story, a quieter one for now, seems to be happening on the other side of the Pacific: Japan’s government may be testing the Bank of Japan’s independence.

Kevin Warsh isn't expected to say much in Sintra: That's exactly why markets will listen

Financial markets could find an important catalyst in the enchanting, fairytale-like landscape of Sintra this week. The ECB Forum will, as it does every year, gather the crème de la crème of central banks. The new boss at the Fed, who has clearly said that the Fed should stop explaining everything, will need to talk – and traders should listen.