|

AUD/USD Price Analysis: Refreshes day’s high at 0.6920 as USD Index drops

  • Australian Dollar has picked strength as Chinese firms have resumed Australian coal imports.
  • The USD Index has sensed sheer selling pressure after failing to surpass 103.00.
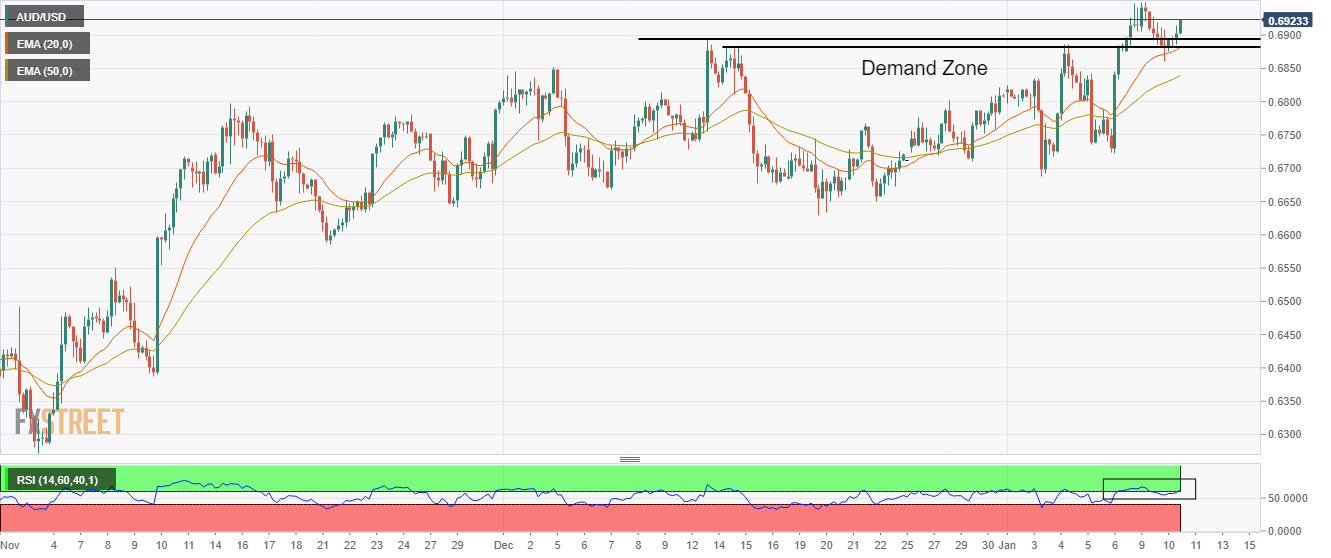
  • Aussie has resumed its upside journey after sensing support around the demand zone plotted in a 0.6884-0.6896 range.

The AUD/USD pair has overstepped its immediate resistance of 0.6917 in the early European session. The Aussie asset has picked strength amid selling pressure in the US Dollar Index (DXY) after the latter failed to surpass the immediate resistance of 103.00.

The market mood is still quiet as S&P500 futures are marginally higher. Out of the major FX currencies, the Australian Dollar is performing better. It seems that the resumption of Australian coal imports by Chinese companies is strengthening the Australian Dollar in comparison with other risk-perceived currencies.

On a four-hour scale, the Aussie asset has resumed its upside journey after sensing support around the demand zone plotted in a 0.6884-0.6896 range. The 20-period Exponential Moving Average (EMA) at 0.6884 is acting as major support for the Australian Dollar. Upward-sloping 50-EMA at 0.6840 indicates that the upside bias is still solid.

Meanwhile, the Relative Strength Index (RSI) is on the edge of recapturing the bullish range of 60.00-80.00, which will trigger the bullish momentum.

For further upside, the Aussie asset needs to surpass Tuesday’s high at 0.6937, which will send the major near the psychological resistance at 0.7000. After conquering 0.7000, Aussie bulls will march towards August 11 high at 0.7137.

On the contrary, a downside move below December 29 low at 0.6710 will drag the major further towards December 22 low at 0.6650 followed by November 21 low at 0.6585.

AUD/USD four-hour chart

AUD/USD

Overview
Today last price0.6924
Today Daily Change0.0031
Today Daily Change %0.45
Today daily open0.6893
 
Trends
Daily SMA200.6765
Daily SMA500.6704
Daily SMA1000.6635
Daily SMA2000.6839
 
Levels
Previous Daily High0.6928
Previous Daily Low0.686
Previous Weekly High0.6887
Previous Weekly Low0.6688
Previous Monthly High0.6893
Previous Monthly Low0.6629
Daily Fibonacci 38.2%0.6886
Daily Fibonacci 61.8%0.6902
Daily Pivot Point S10.6859
Daily Pivot Point S20.6826
Daily Pivot Point S30.6791
Daily Pivot Point R10.6928
Daily Pivot Point R20.6962
Daily Pivot Point R30.6996

Author

Sagar Dua

Sagar Dua

FXStreet

Sagar Dua is associated with the financial markets from his college days. Along with pursuing post-graduation in Commerce in 2014, he started his markets training with chart analysis.

More from Sagar Dua
Share:

Markets move fast. We move first.

Orange Juice Newsletter brings you expert driven insights - not headlines. Every day on your inbox.

By subscribing you agree to our Terms and conditions.

Editor's Picks

EUR/USD clings to small gains near 1.1750

Following a short-lasting correction in the early European session, EUR/USD regains its traction and clings to moderate gains at around 1.1750 on Monday. Nevertheless, the pair's volatility remains low, with investors awaiting this weeks key data releases from the US and the ECB policy announcements.

GBP/USD edges higher toward 1.3400 ahead of US data and BoE

GBP/USD reverses its direction and advances toward 1.3400 following a drop to the 1.3350 area earlier in the day. The US Dollar struggles to gather recovery momentum as markets await Tuesday's Nonfarm Payrolls data, while the Pound Sterling holds steady ahead of the BoE policy announcements later in the week.

Gold stuck around $4,300 as markets turn cautious

Gold loses its bullish momentum and retreats below $4,350 after testing this level earlier on Monday. XAU/USD, however, stays in positive territory as the US Dollar remains on the back foot on growing expectations for a dovish Fed policy outlook next year.

Solana consolidates as spot ETF inflows near $1 billion signal institutional dip-buying

Solana price hovers above $131 at the time of writing on Monday, nearing the upper boundary of a falling wedge pattern, awaiting a decisive breakout. On the institutional side, demand for spot Solana Exchange-Traded Funds remained firm, pushing total assets under management to nearly $1 billion since launch. 

Big week ends with big doubts

The S&P 500 continued to push higher yesterday as the US 2-year yield wavered around the 3.50% mark following a Federal Reserve (Fed) rate cut earlier this week that was ultimately perceived as not that hawkish after all. The cut is especially boosting the non-tech pockets of the market.

Solana Price Forecast: SOL consolidates as spot ETF inflows near $1 billion signal institutional dip-buying

Solana (SOL) price hovers above $131 at the time of writing on Monday, nearing the upper boundary of a falling wedge pattern, awaiting a decisive breakout.