AUD/USD Price Analysis: Recovery fades below 0.7000 amid bearish RSI divergence
- AUD/USD pares intraday gains, seesaws inside nearby symmetrical triangle around two-year low.
- Lower-high prices, higher-high RSI hints at an absence of bullish momentum.
- Previous resistance line from last Thursday will test the bears before giving them control.

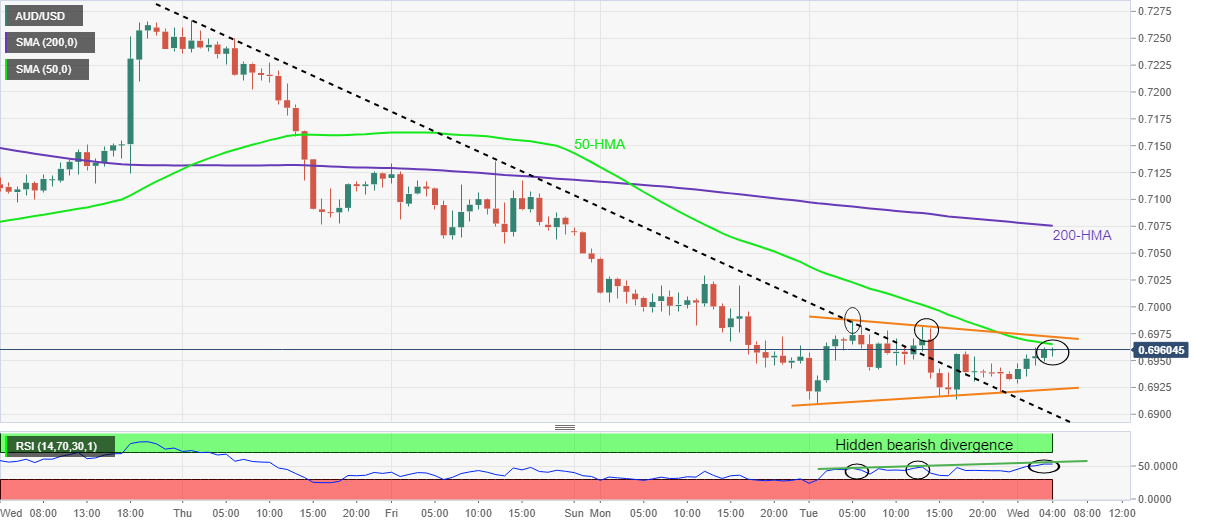
AUD/USD struggles to extend the first daily gains in four as 50-HMA probes recovery moves inside a two-day-old symmetrical triangle. That said, the Aussie pair takes rounds to 0.6955-60 amid the early Wednesday morning in Europe.
Other than the 50-HMA and upper line of the stated triangle, respectively near 0.6965 and 0.6975, the 0.7000 threshold and 200-HMA level of 0.7075 also challenge AUD/USD buyers.
It should be noted that the hidden bearish RSI divergence, a condition where prices fail to improve even as RSI makes higher-high, also keeps the pair sellers hopeful.
Though, the aforementioned triangle’s support line and the previous resistance line from stretched from May 05, respectively near 0.6925 and 0.6900, restrict the pair’s short-term downside.
In a case where AUD/USD drops below 0.6900, it becomes vulnerable to testing the mid-June 2020 low surrounding 0.6775.
On the upside, a clear break post 0.7075 will direct AUD/USD buyers toward challenging the monthly top near 0.7265.
AUD/USD: Hourly chart
Trend: Pullback expected
Author

Anil Panchal
FXStreet
Anil Panchal has nearly 15 years of experience in tracking financial markets. With a keen interest in macroeconomics, Anil aptly tracks global news/updates and stays well-informed about the global financial moves and their implications.


