|

AUD/USD Price Analysis: Intraday recovery falters near mid-0.6500s despite weaker USD

  • AUD/USD recovers RBA-inspired losses and climbs to over a one-week high on Tuesday.
  • Sustained USD selling bias, the risk-on impulse offers support to the risk-sensitive aussie.
  • A one-week-old trading range marks a bearish consolidation phase and warrants caution.

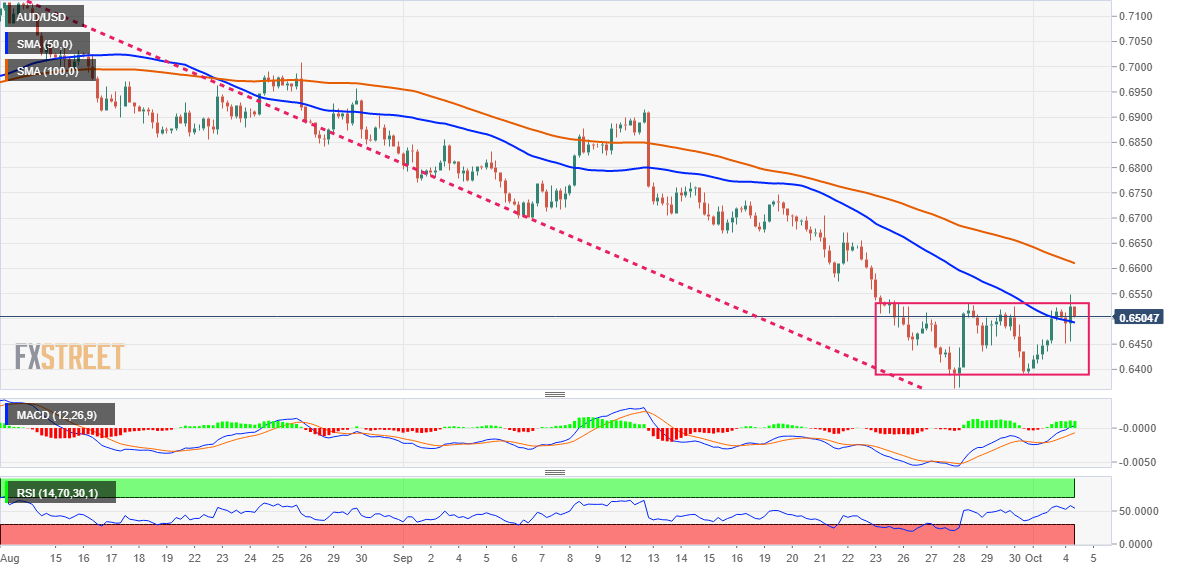
The AUD/USD pair reverses its intraday losses led by the Reserve Bank of Australia's less-than-expected 25 bps rate hike and climbs to over a one-week high during the early part of the European session. The intraday uptick, however, lacks follow-through buying and stalls just ahead of the mid-0.6500s.

The US dollar prolongs its recent sharp corrective pullback from a two-decade high touched last week amid a further slide in the US Treasury bond yields. Apart from this, the risk-on impulse is further weighing on the safe-haven greenback and driving flows towards the risk-sensitive aussie.

Looking at the broader picture, the AUD/USD pair has been oscillating in a narrow trading band over the past week or so. The range-bound price action constitutes the formation of a rectangle on intraday charts and points to indecision among traders over the next leg of a directional move.

Against the backdrop of a sharp fall from the August monthly swing high, the formation might still be categorized as a bearish consolidation phase. Furthermore, technical indicators on the daily chart - though have been recovering from lower levels - are still holding in the bearish territory.

This, in turn, suggests that the path of least resistance for the AUD/USD pair is to the downside and warrants caution for bullish traders. That said, some follow-through buying will negate the bearish bias and set the stage for some meaningful appreciating move in the near term.

The AUD/USD pair might then build on its recent bounce from its lowest level since April 2020 and aim to reclaim the 0.6600 round-figure mark. This is followed by the 0.6620-0.6625 resistance zone, above which a fresh bout of a short-covering move could lift spot prices to the 0.6700 mark.

On the flip side, the post-RBA low, around mid-0.6400s, now seems to protect the immediate downside ahead of the 0.6400 round figure. A convincing break below will make the AUD/USD pair vulnerable to weakening further below the YTD low, around the 0.6365-0.6360 area and test the 0.6300 mark.

AUD/USD 4-hour chart

fxsoriginal

Key levels to watch

AUD/USD

Overview
Today last price0.6519
Today Daily Change0.0004
Today Daily Change %0.06
Today daily open0.6515
 
Trends
Daily SMA200.6647
Daily SMA500.6825
Daily SMA1000.69
Daily SMA2000.7072
 
Levels
Previous Daily High0.6522
Previous Daily Low0.6402
Previous Weekly High0.6538
Previous Weekly Low0.6363
Previous Monthly High0.6916
Previous Monthly Low0.6363
Daily Fibonacci 38.2%0.6476
Daily Fibonacci 61.8%0.6448
Daily Pivot Point S10.6438
Daily Pivot Point S20.636
Daily Pivot Point S30.6318
Daily Pivot Point R10.6558
Daily Pivot Point R20.66
Daily Pivot Point R30.6677

Author

Haresh Menghani

Haresh Menghani is a detail-oriented professional with 10+ years of extensive experience in analysing the global financial markets.

More from Haresh Menghani
Share:

Editor's Picks

EUR/USD slumps below 1.1750 as USD benefits from risk-aversion

EUR/USD comes under renewed bearish pressure in the European session and trades below 1.1750 following a recovery attempt earlier in the day. The US Dollar gathers strength and weighs on the pair as investors seek refuge in the wake of Israel and the United States' joint attack on Iran.

GBP/USD targets 1.3500 barrier near moving averages

GBP/USD rebounds from the daily losses, trading around 1.3450 during the Asian hours on Monday. The technical analysis of the daily chart indicates an ongoing bearish bias, as the pair trades within a descending channel pattern.

Gold surges on safe-haven demand, rises above $5,400

Gold benefits from intense risk-aversion on Monday and climbs above $5,400, setting a fresh monthly-high in the process. Tensions in the Middle East remain high as Israel and Hezbollah continue to exchange strikes following the US-Israel joint attack on Iran over the weekend.

Bitcoin, Ethereum and Ripple under pressure as key supports face breakdown risk

Bitcoin, Ethereum, and Ripple prices trade on the back foot at the start of this week on Monday, after extending losses in the previous week. BTC is on the brink of a breakdown, ETH is capped below key resistance, and XRP risks a crack of the trendline.

The market is paying for insurance, not apocalypse

As expected, this morning felt less like a Monday market open and more like a fire drill. Futures screens flickered red. S&P contracts down almost 1%. Nasdaq off 1.2%. Brent leaped 13% through $80. Gold rose 1.6% toward $5350 before paring some gains. The dollar is strutting mildly. The Swiss franc is quietly doing what it always does in a storm, catching some safe-haven flows.

Pi Network Price Forecast: Core team offloads supply, weighing on PI recovery

Pi Network  hovers below $0.1700, broadly steady at press time on Monday, attempting a recovery after a 2% loss the previous day. Sunday’s decline aligned with nearly 49 million PI tokens offloaded by the Pi Foundation, implying a spike in supply pressure that capped the prevailing four-day recovery.