AUD/USD Price Analysis: Drops to fortnight low under 0.7200 on rising wedge confirmation


  • AUD/USD drops to the lowest in two weeks on confirming a bearish chart pattern.
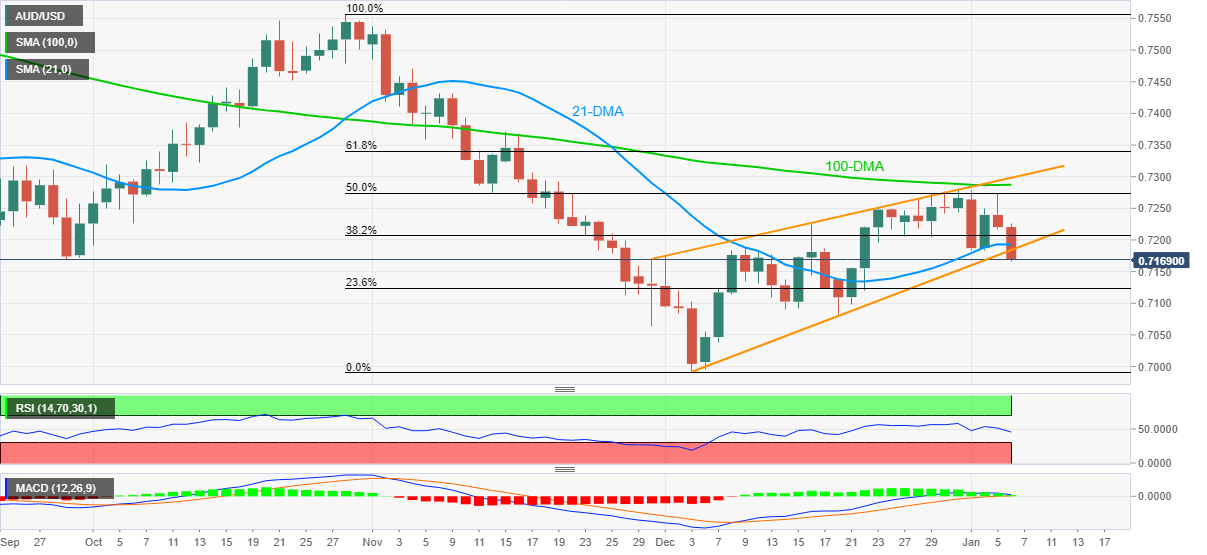
  • RSI retreat, receding bullish bias of MACD also favor sellers.
  • Key SMAs restrict immediate upside, 2021 bottom lures bears.

AUD/USD takes offers around 0.7170, down 0.70% intraday to flash a two-week low during early Thursday morning in Europe.

Following a clear downside break of 21-DMA, AUD/USD prices broke the support line of a monthly rising wedge bearish chart formation, which in turn underpin the latest losses of the quote. Also adding to the bearish bias are the downbeat RSI and MACD conditions.

That said, the late December’s swing low around 0.7080 may offer an intermediate halt during the quote’s theoretical target surrounding the 0.7000 threshold, comprising 2021 low.

In a case where the AUD/USD prices remain bearish past 0.7000, June 2020 low near 0.6775 will be in focus.

Alternatively, the support-turned-resistance line of the wedge and 21-DMA, respectively around 0.7185 and 0.7195, will restrict the quote’s corrective pullback.

It’s worth noting that a clear upside break of 0.7195 will propel the quote towards 50% Fibonacci retracement (Fibo.) of October-December downside, around 0.7275.

Though, the AUD/USD pair’s advances beyond 50% Fibo. will be challenged by the 100-DMA and resistance line of the stated wedge, close to 0.7290 and 0.7305 in that order.

AUD/USD; Daily chart

Trend: Further weakness expected

Additional important levels

Overview
Today last price 0.7174
Today Daily Change -0.0046
Today Daily Change % -0.64%
Today daily open 0.722
 
Trends
Daily SMA20 0.7194
Daily SMA50 0.7242
Daily SMA100 0.7287
Daily SMA200 0.7439
 
Levels
Previous Daily High 0.7273
Previous Daily Low 0.7216
Previous Weekly High 0.7278
Previous Weekly Low 0.7204
Previous Monthly High 0.7278
Previous Monthly Low 0.6993
Daily Fibonacci 38.2% 0.7238
Daily Fibonacci 61.8% 0.7251
Daily Pivot Point S1 0.72
Daily Pivot Point S2 0.7179
Daily Pivot Point S3 0.7143
Daily Pivot Point R1 0.7257
Daily Pivot Point R2 0.7293
Daily Pivot Point R3 0.7314


Share: Feed news

Information on these pages contains forward-looking statements that involve risks and uncertainties. Markets and instruments profiled on this page are for informational purposes only and should not in any way come across as a recommendation to buy or sell in these assets. You should do your own thorough research before making any investment decisions. FXStreet does not in any way guarantee that this information is free from mistakes, errors, or material misstatements. It also does not guarantee that this information is of a timely nature. Investing in Open Markets involves a great deal of risk, including the loss of all or a portion of your investment, as well as emotional distress. All risks, losses and costs associated with investing, including total loss of principal, are your responsibility. The views and opinions expressed in this article are those of the authors and do not necessarily reflect the official policy or position of FXStreet nor its advertisers. The author will not be held responsible for information that is found at the end of links posted on this page.

If not otherwise explicitly mentioned in the body of the article, at the time of writing, the author has no position in any stock mentioned in this article and no business relationship with any company mentioned. The author has not received compensation for writing this article, other than from FXStreet.

FXStreet and the author do not provide personalized recommendations. The author makes no representations as to the accuracy, completeness, or suitability of this information. FXStreet and the author will not be liable for any errors, omissions or any losses, injuries or damages arising from this information and its display or use. Errors and omissions excepted.

The author and FXStreet are not registered investment advisors and nothing in this article is intended to be investment advice.

Recommended content


Recommended content

Editors’ Picks

EUR/USD clings to daily gains above 1.0650

EUR/USD clings to daily gains above 1.0650

EUR/USD gained traction and turned positive on the day above 1.0650. The improvement seen in risk mood following the earlier flight to safety weighs on the US Dollar ahead of the weekend and helps the pair push higher.

EUR/USD News

GBP/USD recovers toward 1.2450 after UK Retail Sales data

GBP/USD recovers toward 1.2450 after UK Retail Sales data

GBP/USD reversed its direction and advanced to the 1.2450 area after touching a fresh multi-month low below 1.2400 in the Asian session. The positive shift seen in risk mood on easing fears over a deepening Iran-Israel conflict supports the pair.

GBP/USD News

Gold holds steady at around $2,380 following earlier spike

Gold holds steady at around $2,380 following earlier spike

Gold stabilized near $2,380 after spiking above $2,400 with the immediate reaction to reports of Israel striking Iran. Meanwhile, the pullback seen in the US Treasury bond yields helps XAU/USD hold its ground.

Gold News

Bitcoin Weekly Forecast: BTC post-halving rally could be partially priced in Premium

Bitcoin Weekly Forecast: BTC post-halving rally could be partially priced in

Bitcoin price shows no signs of directional bias while it holds above  $60,000. The fourth BTC halving is partially priced in, according to Deutsche Bank’s research. 

Read more

Week ahead – US GDP and BoJ decision on top of next week’s agenda

Week ahead – US GDP and BoJ decision on top of next week’s agenda

US GDP, core PCE and PMIs the next tests for the Dollar. Investors await BoJ for guidance about next rate hike. EU and UK PMIs, as well as Australian CPIs also on tap.

Read more

Forex MAJORS

Cryptocurrencies

Signatures