AUD/USD Price Analysis: Bulls extend 200-EMA breakout towards 0.7000


  • AUD/USD clings to mild gains during two-day rebound from monthly low.
  • Sustained break of 200-EMA joins upbeat oscillators to favor buyers.
  • Two-week-old horizontal resistance area challenges immediate upside while ascending trend line from late December probes bears.

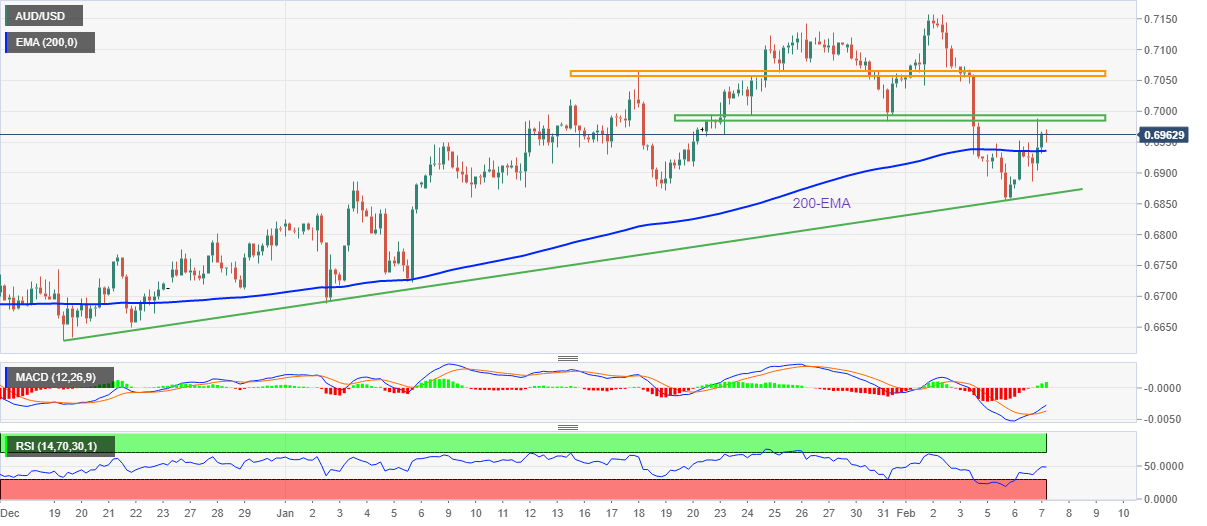
AUD/USD holds onto the previous day’s recovery moves near 0.6960 as buyers keep the reins on crossing the 200-bar Exponential Moving Average (EMA) during early Wednesday. In doing so, the Aussie pair marches towards a fortnight-old horizontal resistance region amid bullish signals from MACD and a gradual rise in the RSI (14) line.

That said, the risk-barometer pair is likely to overcome the immediate hurdle surrounding the 0.7000 psychological magnet. However, an area comprising multiple levels marked since January 18, close to 0.7060 could challenge the AUD/USD buyers afterward.

In a case where the AUD/USD price remains firmer past 0.7060, a run-up towards the 0.7100 round figure and then to the monthly high surrounding 0.7160 can’t be ruled out.

It should be noted that the Aussie pair’s successful rise above 0.7160 could challenge June 2022 high near 0.7285.

Meanwhile, AUD/USD bears aren’t safe if they take entries on the quote’s fresh downside below the 200-EMA, around 0.6935.

The reason could be linked to the quote’s multiple bounces off an upward-sloping support line from late December 2022, close to 0.6865 at the latest. Following that, the monthly low of 0.6855 may act as the last defense of the AUD/USD bulls.

AUD/USD: Four-hour chart

Trend: Further upside expected

Additional important levels

Overview
Today last price 0.6961
Today Daily Change 0.0010
Today Daily Change % 0.14%
Today daily open 0.6951
 
Trends
Daily SMA20 0.7005
Daily SMA50 0.6862
Daily SMA100 0.6674
Daily SMA200 0.6809
 
Levels
Previous Daily High 0.6989
Previous Daily Low 0.6879
Previous Weekly High 0.7158
Previous Weekly Low 0.6919
Previous Monthly High 0.7143
Previous Monthly Low 0.6688
Daily Fibonacci 38.2% 0.6947
Daily Fibonacci 61.8% 0.6921
Daily Pivot Point S1 0.6891
Daily Pivot Point S2 0.683
Daily Pivot Point S3 0.6781
Daily Pivot Point R1 0.7
Daily Pivot Point R2 0.7049
Daily Pivot Point R3 0.7109


Share: Feed news

Information on these pages contains forward-looking statements that involve risks and uncertainties. Markets and instruments profiled on this page are for informational purposes only and should not in any way come across as a recommendation to buy or sell in these assets. You should do your own thorough research before making any investment decisions. FXStreet does not in any way guarantee that this information is free from mistakes, errors, or material misstatements. It also does not guarantee that this information is of a timely nature. Investing in Open Markets involves a great deal of risk, including the loss of all or a portion of your investment, as well as emotional distress. All risks, losses and costs associated with investing, including total loss of principal, are your responsibility. The views and opinions expressed in this article are those of the authors and do not necessarily reflect the official policy or position of FXStreet nor its advertisers. The author will not be held responsible for information that is found at the end of links posted on this page.

If not otherwise explicitly mentioned in the body of the article, at the time of writing, the author has no position in any stock mentioned in this article and no business relationship with any company mentioned. The author has not received compensation for writing this article, other than from FXStreet.

FXStreet and the author do not provide personalized recommendations. The author makes no representations as to the accuracy, completeness, or suitability of this information. FXStreet and the author will not be liable for any errors, omissions or any losses, injuries or damages arising from this information and its display or use. Errors and omissions excepted.

The author and FXStreet are not registered investment advisors and nothing in this article is intended to be investment advice.

Recommended content


Recommended content

Editors’ Picks

EUR/USD extends gains above 1.0700, focus on key US data

EUR/USD extends gains above 1.0700, focus on key US data

EUR/USD meets fresh demand and rises toward  1.0750 in the European session on Thursday. Renewed US Dollar weakness offsets the risk-off market environment, supporting the pair ahead of the key US GDP and PCE inflation data. 

EUR/USD News

GBP/USD extends recovery above 1.2500, awaits US GDP data

GBP/USD extends recovery above 1.2500, awaits US GDP data

GBP/USD is catching a fresh bid wave, rising above 1.2500 in European trading on Thursday. The US Dollar resumes its corrective downside, as traders resort to repositioning ahead of the high-impact US advance GDP data for the first quarter. 

GBP/USD News

Gold price edges higher amid weaker USD and softer risk tone, focus remains on US GDP

Gold price edges higher amid weaker USD and softer risk tone, focus remains on US GDP

Gold price (XAU/USD) attracts some dip-buying in the vicinity of the $2,300 mark on Thursday and for now, seems to have snapped a three-day losing streak, though the upside potential seems limited. 

Gold News

Injective price weakness persists despite over 5.9 million INJ tokens burned

Injective price weakness persists despite over 5.9 million INJ tokens burned

Injective price is trading with a bearish bias, stuck in the lower section of the market range. The bearish outlook abounds despite the network's deflationary efforts to pump the price. 

Read more

US Q1 GDP Preview: Economic growth set to remain firm in, albeit easing from Q4

US Q1 GDP Preview: Economic growth set to remain firm in, albeit easing from Q4

The United States Gross Domestic Product (GDP) is seen expanding at an annualized rate of 2.5% in Q1. The current resilience of the US economy bolsters the case for a soft landing. 

Read more

Forex MAJORS

Cryptocurrencies

Signatures