AUD/USD Price Analysis: BPC formation tests bulls below 0.7200
- AUD/USD retreats from intraday top, stays up for the third consecutive day.
- 100-SMA, previous support restricts short-term upside amid sluggish MACD.
- 61.8% Fibonacci retracement lures sellers, bulls have multiple hurdles below 0.7300.

AUD/USD steps back from intraday high to 0.7185 heading into Tuesday’s European session. Even so, the Aussie pair prints a three-day uptrend by the press time.
AUD/USD portrays a Break-Pullback-Continuation (BPC) chart pattern on the four-hour play while observing Thursday’s rising wedge confirmation, followed by a corrective pullback from 50% Fibonacci retracement of December’s advances.
Given the recent U-turn from the previous resistance, the Aussie pair eyes further losses below the 0.7200 round figure, backed by receding bullish bias of the MACD signals.
That said, the latest swing low around 0.7140 acts as immediate support before the 61.8% Fibonacci retracement level around the 0.7100 threshold.
Adding to the downside filter is the December 20 bottom surrounding 0.7080, a break of which will make the quote vulnerable to aim for 2021 bottom near 0.6993.
It’s worth noting, however, that buyers will gain confidence on a clear upside break of the 0.7200 mark, comprising the 100-SMA and bearish wedge’s support line, now resistance.
Following that, the last monthly peak near 0.7275 and an upward sloping trend line from mid-December, close to 0.7315, will be in focus.
AUD/USD: Four-hour chart
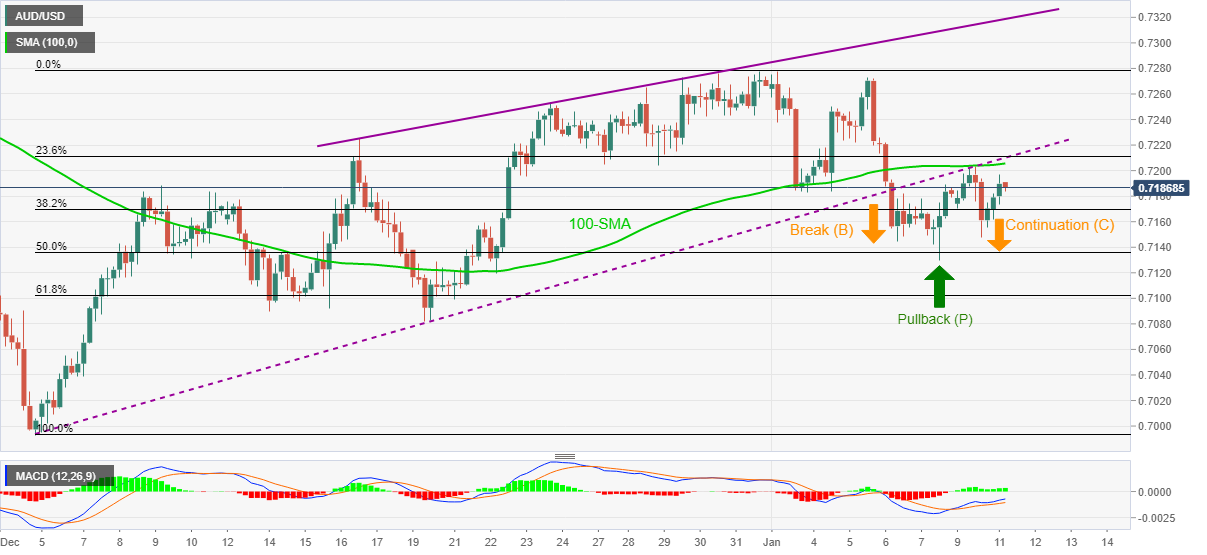
Trend: Further weakness expected
Author

Anil Panchal
FXStreet
Anil Panchal has nearly 15 years of experience in tracking financial markets. With a keen interest in macroeconomics, Anil aptly tracks global news/updates and stays well-informed about the global financial moves and their implications.


