USD/INR declines while consistent FIIs selling keeps outlook upbeat
- The Indian Rupee gains against the US Dollar at open in a thin trading volume day.
- FIIs turned out to be net sellers in 17 out of 20 trading days so far this month.
- Investors await FOMC minutes for fresh cues on the US interest rate outlook.

The Indian Rupee (INR) moves higher against the US Dollar (USD) during afternoon trading hours in India on Tuesday. The USD/INR pair falls to near 90.08, with trading volume remaining squeezed in the final stretch of the year. However, the near-term bias of the pair remains bullish due to the consistent outflow of foreign funds from the Indian stock market.
On Monday, Foreign Institutional Investors (FIIs) offloaded their stake worth Rs. 2,759.89 crore in the Indian equity market. So far this month, FIIs have remained net sellers in 17 out of 20 trading days and have pared their stake worth Rs. 26,908.22 crore.
Overseas investors have been keeping a distance from the Indian secondary market amid the trade stalemate between the United States (US) and India. Negotiators from both nations have expressed several times that they are close to reaching a trade deal, but have not announced so far, due to which Washington is charging 50% tariffs on imports from New Delhi, the highest among all its trading partners.
In Tuesday’s session, investors will focus on the Trade Deficit – RBI (Q3), which will be published at 17:00 GMT. The data will show the change in the total amount of goods and services exported from and imported by India.
The table below shows the percentage change of Indian Rupee (INR) against listed major currencies today. Indian Rupee was the strongest against the Euro.
| USD | EUR | GBP | JPY | CAD | AUD | INR | CHF | |
|---|---|---|---|---|---|---|---|---|
| USD | 0.02% | -0.03% | -0.06% | -0.07% | -0.20% | -0.13% | 0.00% | |
| EUR | -0.02% | -0.06% | -0.09% | -0.09% | -0.23% | -0.19% | -0.02% | |
| GBP | 0.03% | 0.06% | -0.02% | -0.04% | -0.17% | -0.10% | 0.02% | |
| JPY | 0.06% | 0.09% | 0.02% | -0.01% | -0.13% | -0.09% | 0.10% | |
| CAD | 0.07% | 0.09% | 0.04% | 0.00% | -0.13% | -0.07% | 0.06% | |
| AUD | 0.20% | 0.23% | 0.17% | 0.13% | 0.13% | 0.04% | 0.19% | |
| INR | 0.13% | 0.19% | 0.10% | 0.09% | 0.07% | -0.04% | 0.17% | |
| CHF | -0.00% | 0.02% | -0.02% | -0.10% | -0.06% | -0.19% | -0.17% |
The heat map shows percentage changes of major currencies against each other. The base currency is picked from the left column, while the quote currency is picked from the top row. For example, if you pick the Indian Rupee from the left column and move along the horizontal line to the US Dollar, the percentage change displayed in the box will represent INR (base)/USD (quote).
Daily Digest Market Movers: US Dollar trades calm in countdown to FOMC minutes
- Another reason behind the sideways move in the USD/INR pair is the steady US Dollar ahead of the release of Federal Open Market Committee (FOMC) minutes of the December meeting in the late New York session.
- During the press time, the US Dollar Index (DXY), which tracks the Greenback’s value against six major currencies, trades flat around 98.00.
- Investors will pay close attention to FOMC minutes to get fresh cues on the monetary policy outlook for 2026.
- In the policy meeting, the Fed decided to cut interest rates by 25 basis points (bps) to 3.50%-3.75%. This was the third interest rate cut by the Fed in a row. Fed policymakers signaled that monetary policy conditions needed to loosen further to support deteriorating job market conditions.
- After the policy outcome, San Francisco Fed Bank President Mary Daly also stated that she favored interest rate cuts in the policy meeting, as the job market is getting softer, and added that policymakers cannot let the labor market falter.
- In the policy announcement, the Fed’s Economic Projections report showed that policymakers collectively see the Federal Funds Rate heading to 3.4% by the end of 2026, indicating that there will be only one interest rate cut in the entire next year.
- Contrary to the Fed’s projections, the CME FedWatch tool shows that the Fed will cut borrowing rates by at least 50 bps in 2026.
- Next year, the major highlight will be the announcement of Fed Chair Jerome Powell’s successor by the White House. United States (US) President Donald Trump said on Monday that he plans to announce his pick for “the next chair sometime in January”. Latest comments from Trump have signaled that former Fed Chair Kevin Warsh, White House Economic Adviser Kevin Hassett, current Fed Governors Christopher Waller and Michelle Bowman are leading contenders for the post of the Fed’s next Chairman.
Technical Analysis: USD/INR stays close to 20-day EMA
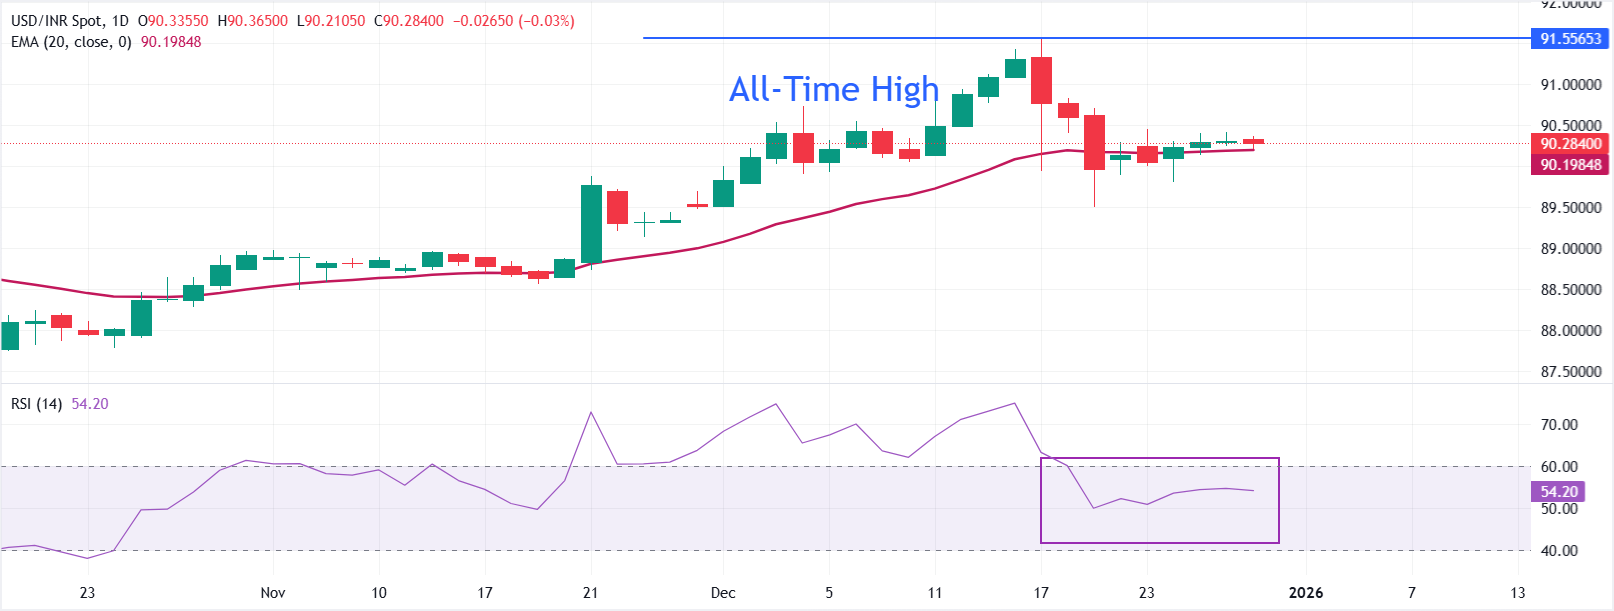
USD/INR trades flat near 90.30 in the opening trade on Tuesday. The 20-day Exponential Moving Average is rising at 90.20, with price holding above it and preserving a mild bullish bias. The 20-day EMA has been edging higher for several sessions, underscoring steady demand.
The 14-day Relative Strength Index (RSI) at 54 (neutral) reflects balanced momentum after easing from prior overbought readings.
Price action continues to respect the ascending 20-day EMA, which acts as immediate support at 90.20. A sustained close above this average keeps the trend profile positive and could encourage further upside toward the all-time high of 91.55, while a break below it would tilt the bias toward consolidation.
(The technical analysis of this story was written with the help of an AI tool.)
Fed FAQs
Monetary policy in the US is shaped by the Federal Reserve (Fed). The Fed has two mandates: to achieve price stability and foster full employment. Its primary tool to achieve these goals is by adjusting interest rates. When prices are rising too quickly and inflation is above the Fed’s 2% target, it raises interest rates, increasing borrowing costs throughout the economy. This results in a stronger US Dollar (USD) as it makes the US a more attractive place for international investors to park their money. When inflation falls below 2% or the Unemployment Rate is too high, the Fed may lower interest rates to encourage borrowing, which weighs on the Greenback.
The Federal Reserve (Fed) holds eight policy meetings a year, where the Federal Open Market Committee (FOMC) assesses economic conditions and makes monetary policy decisions. The FOMC is attended by twelve Fed officials – the seven members of the Board of Governors, the president of the Federal Reserve Bank of New York, and four of the remaining eleven regional Reserve Bank presidents, who serve one-year terms on a rotating basis.
In extreme situations, the Federal Reserve may resort to a policy named Quantitative Easing (QE). QE is the process by which the Fed substantially increases the flow of credit in a stuck financial system. It is a non-standard policy measure used during crises or when inflation is extremely low. It was the Fed’s weapon of choice during the Great Financial Crisis in 2008. It involves the Fed printing more Dollars and using them to buy high grade bonds from financial institutions. QE usually weakens the US Dollar.
Quantitative tightening (QT) is the reverse process of QE, whereby the Federal Reserve stops buying bonds from financial institutions and does not reinvest the principal from the bonds it holds maturing, to purchase new bonds. It is usually positive for the value of the US Dollar.
Author

Sagar Dua
FXStreet
Sagar Dua is associated with the financial markets from his college days. Along with pursuing post-graduation in Commerce in 2014, he started his markets training with chart analysis.