|

AUD/USD Price Analysis: Bears eyeing break of critical H4 support

  • AUD/USD bears are moving in on the 4-hour chart. 
  • Weely structure is critical at this point and bears will note the resistance. 

AUD/USD is pressing up against an important resistance on the longer-term charts. The bears could be looking to move in at this juncture and the 4-hour chart analysis illustrates the key levels in the following top-down analysis. 

AUD/USD prior analysis

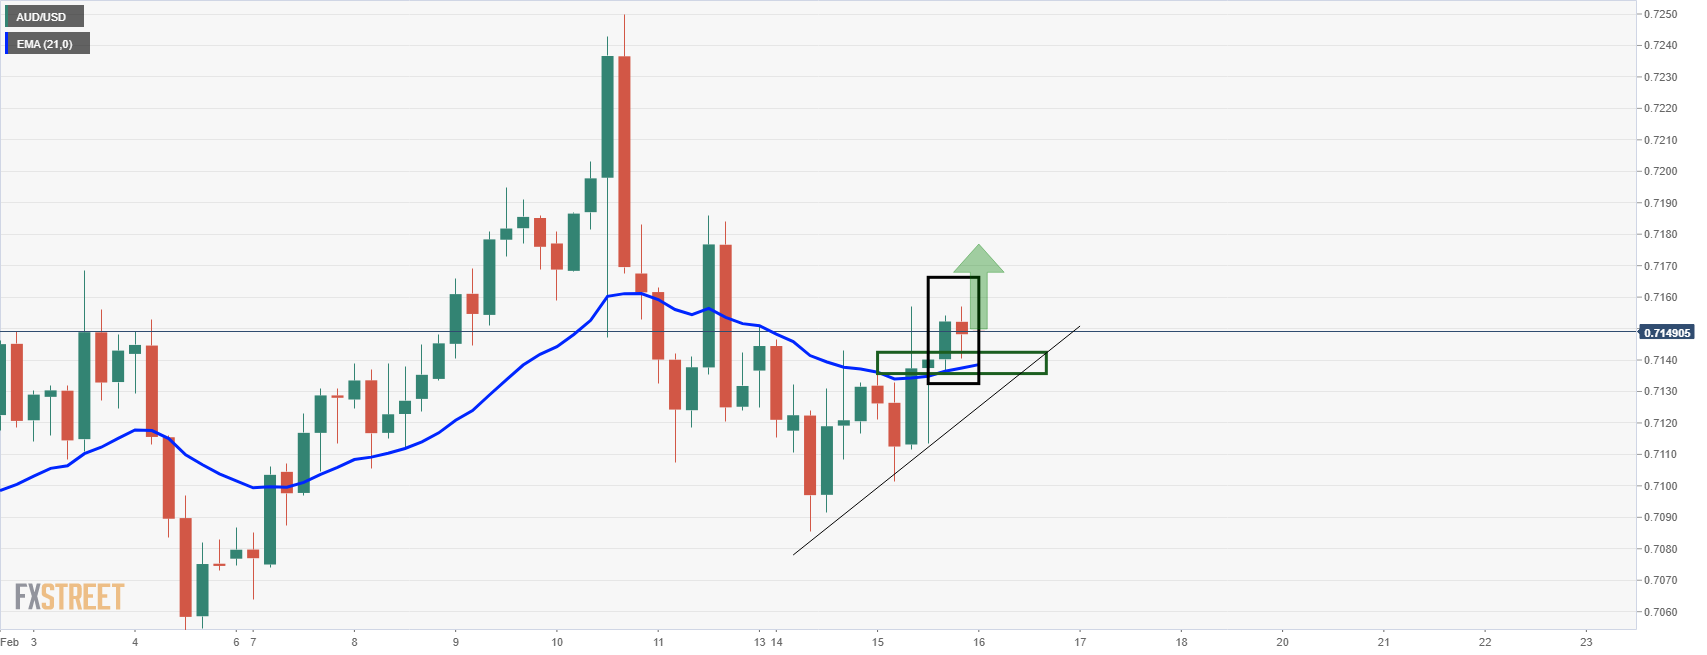
The price had been respecting the 21 EMA and support structure as illustrated above and bulls would have been seeking to engage at a discount at this juncture. 

AUD/USD weekly chart

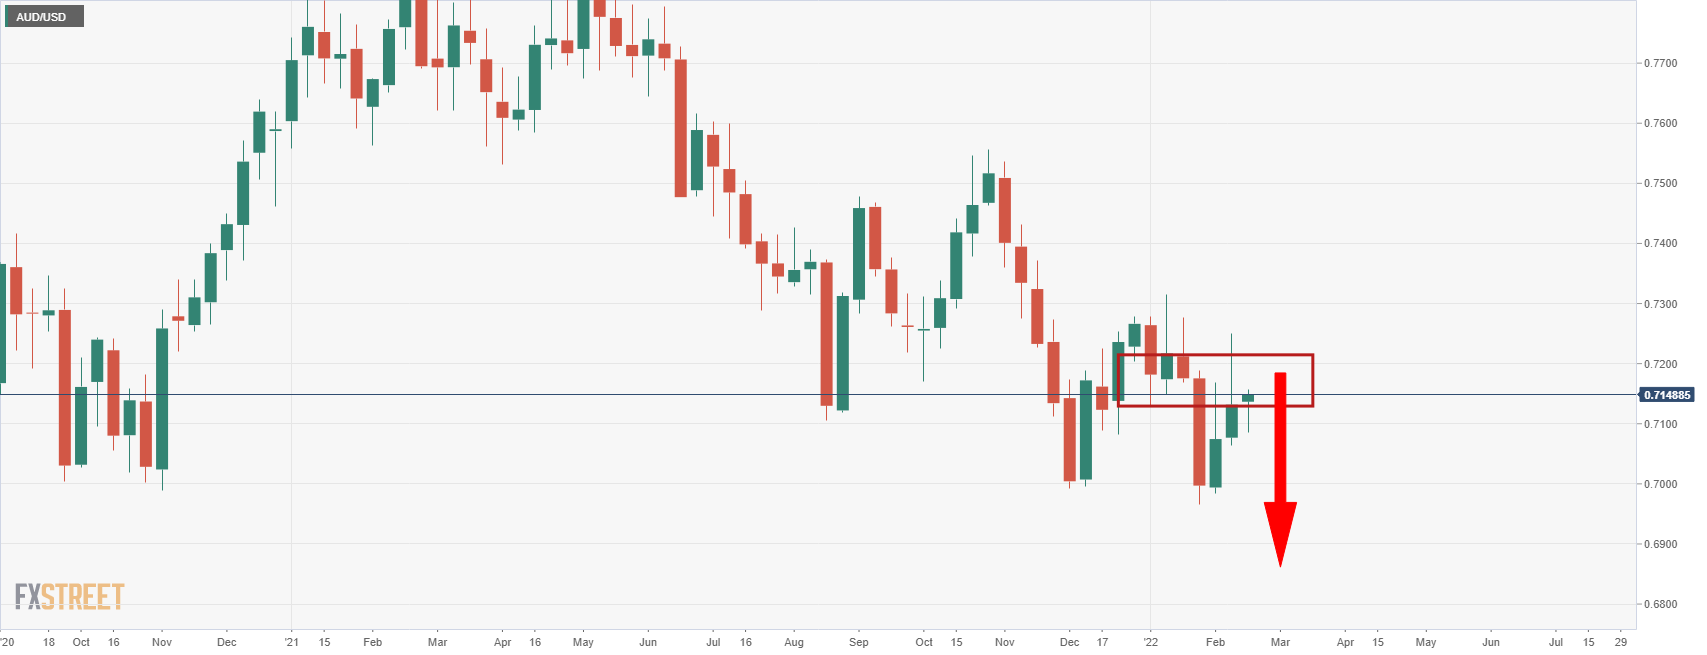
On the other hand, on the weekly chart, the bears were taking note of the resistance and this leaves the price vulnerable still for the days ahead. 

AUD/USD live market 

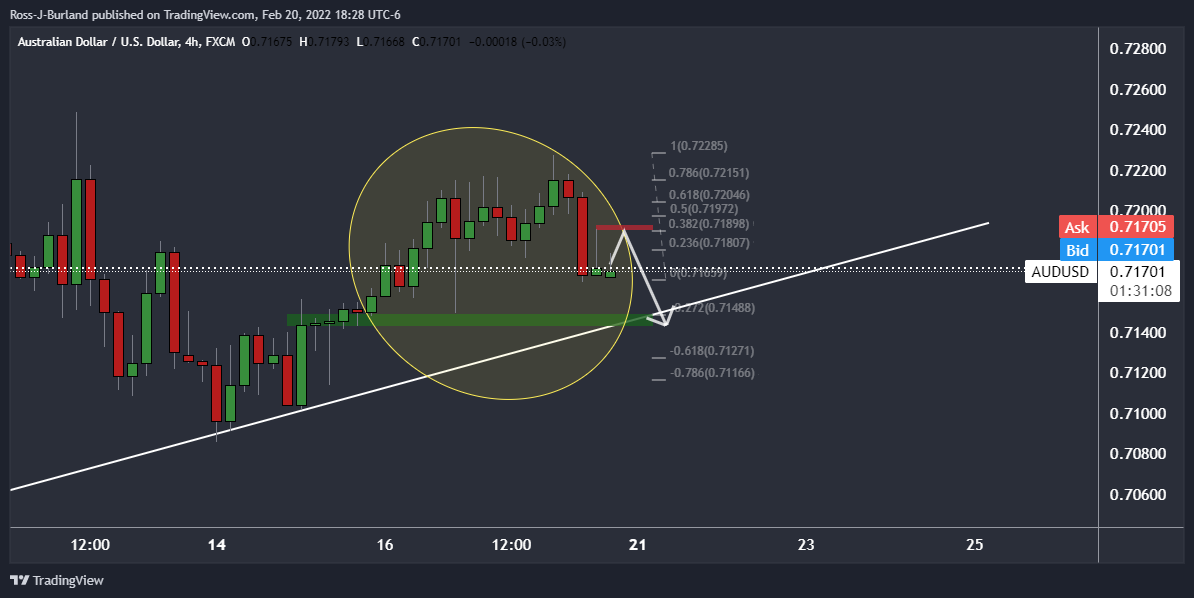
The price did indeed resect the support and rallied from there, as forecasted in the prior analysis above. The big bearish candle is now the focus with the price so far capped by a 38.2% Fibo retracement of the bearish impulse.

The focus is on the downside for a restest of the support near 0.7150. Below there, the bears could be encouraged to move to the longer-term charts and assess the landscape as follows:

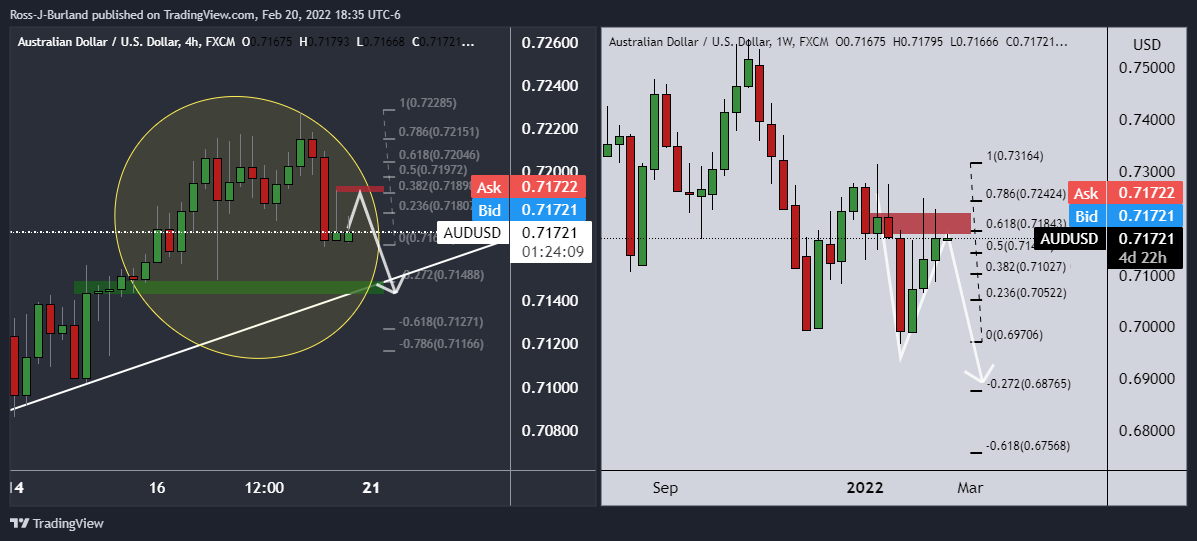
The 4-hour chart, left, shows where price could head to, 0.7150, and a break of which will open the risk of the beginnings of a significant shift longer-term in the price's trajectory, according to the weekly chart, right. 

Author

Ross J Burland

Ross J Burland, born in England, UK, is a sportsman at heart. He played Rugby and Judo for his county, Kent and the South East of England Rugby team.

More from Ross J Burland
Share:

Editor's Picks

EUR/USD stays well offered below 1.1800

The selling pressure on EUR/USD is picking up pace, with the pair slipping decisively below the key 1.1800 level and sliding to fresh two week lows as Wednesday’s session draws to a close. The move lower comes as the US Dollar finds renewed strength after the latest round of US data and the release of the FOMC Minutes. Next of note on the docket will be the US weekly Initial Jobless Claims.
 

GBP/USD reaches multi-day lows near 1.3500

GBP/USD reverses its initial upside momentum and is now adding to previous declines, approaching the 1.3500 region on Wednesday. Cable’s downtick comes on the back of decent gains in the Greenback and easing UK inflation figures, which seem to have reinforced the case for a BoE rate cut in March.

Gold battle to regain $5,000 continues

Gold is back on the front foot on Wednesday, shaking off part of the early week softness and challenging two-day highs near the $5,000 mark per troy ounce. The move comes ahead of the FOMC Minutes and is unfolding despite an intense rebound in the US Dollar.

Bitcoin has found or is near a bottom, extended consolidation to follow: K33

Bitcoin (BTC) is nearing or has already established a bottom, which could be followed by a sustained period of slow price movement, according to K33.

Mixed UK inflation data no gamechanger for the Bank of England

Food inflation plunged in January, but service sector price pressure is proving stickier. We continue to expect Bank of England rate cuts in March and June. The latest UK inflation read is a mixed bag for the Bank of England, but we doubt it drastically changes the odds of a March rate cut.

Sui extends sideways action ahead of Grayscale’s GSUI ETF launch

Sui is extending its downtrend for the second consecutive day, trading at 0.95 at the time of writing on Wednesday. The Layer-1 token is down over 16% in February and approximately 34% from the start of the year, aligning with the overall bearish sentiment across the crypto market.