|

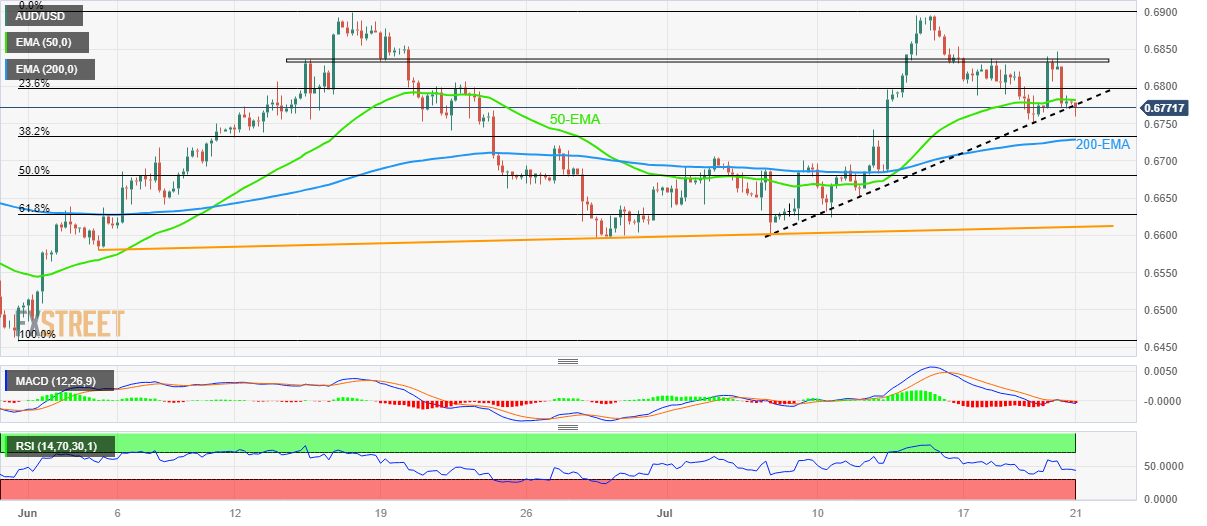
AUD/USD Price Analysis: Bears approach 0.6730 confluence level on breaking nearby support

  • AUD/USD slides beneath 50-EMA, fortnight-old support line to lure sellers.
  • Downbeat oscillators, trend line break direct Aussie bears toward convergence of 200-EMA, 38.2% Fibonacci retracement.
  • Five-week-long horizontal region, double tops around 0.6900 act as additional upside filters.

AUD/USD prints mild losses around 0.6775-70 as it reverses the previous day’s corrective bounce amid Friday’s Asian session.

The Aussie pair’s latest weakness could be linked to the downside break of the 50-bar Exponential Moving Average (EMA) and a two-week-long rising support line. Adding strength to the downside bias is the market’s cautious mood, as well as bearish MACD signals and a steady RSI (14) line.

With this, the AUD/USD bears appear well set to target the 0.6730 support confluence comprising the 200-EMA and 38.2% Fibonacci retracement of its May 31 to June 16 upside.

However, the quote’s downside past 0.6730 has multiple supports to conquer before convincing the bears. Among them, an upward-sloping trend line from June 05, near 0.6610 at the latest, gains major attention.

On the flip side, the support-turned-resistance and the 50-EMA, around 0.6780 by the press time, restrict the immediate upside of the AUD/USD pair.

Following that, a horizontal area comprising multiple levels marked since mid-June, near 0.6830-35, will be an important hurdle to watch for the bulls.

Above all, the double tops around 0.6900 appears a tough nut to crack for the Aussie pair buyers.

AUD/USD: Four-hour chart

Trend: Further downside expected

Additional important levels

Overview
Today last price0.6772
Today Daily Change-0.0007
Today Daily Change %-0.10%
Today daily open0.6779
 
Trends
Daily SMA200.6716
Daily SMA500.6689
Daily SMA1000.6687
Daily SMA2000.6715
 
Levels
Previous Daily High0.6847
Previous Daily Low0.6766
Previous Weekly High0.6895
Previous Weekly Low0.6624
Previous Monthly High0.69
Previous Monthly Low0.6484
Daily Fibonacci 38.2%0.6816
Daily Fibonacci 61.8%0.6797
Daily Pivot Point S10.6747
Daily Pivot Point S20.6716
Daily Pivot Point S30.6666
Daily Pivot Point R10.6829
Daily Pivot Point R20.6878
Daily Pivot Point R30.691

Author

Anil Panchal

Anil Panchal

FXStreet

Anil Panchal has nearly 15 years of experience in tracking financial markets. With a keen interest in macroeconomics, Anil aptly tracks global news/updates and stays well-informed about the global financial moves and their implications.

More from Anil Panchal
Share:

Markets move fast. We move first.

Orange Juice Newsletter brings you expert driven insights - not headlines. Every day on your inbox.

By subscribing you agree to our Terms and conditions.

Editor's Picks

EUR/USD rebounds after falling toward 1.1700

EUR/USD gains traction and trades above 1.1730 in the American session, looking to end the week virtually unchanged. The bullish opening in Wall Street makes it difficult for the US Dollar to preserve its recovery momentum and helps the pair rebound heading into the weekend.

GBP/USD steadies below 1.3400 as traders assess BoE policy outlook

Following Thursday's volatile session, GBP/USD moves sideways below 1.3400 on Friday. Investors reassess the Bank of England's policy oıtlook after the MPC decided to cut the interest rate by 25 bps by a slim margin. Meanwhile, the improving risk mood helps the pair hold its ground.

Gold stays below $4,350, looks to post small weekly gains

Gold struggles to gather recovery momentum and stays below $4,350 in the second half of the day on Friday, as the benchmark 10-year US Treasury bond yield edges higher. Nevertheless, the precious metal remains on track to end the week with modest gains as markets gear up for the holiday season.

Crypto Today: Bitcoin, Ethereum, XRP rebound amid bearish market conditions

Bitcoin (BTC) is edging higher, trading above $88,000 at the time of writing on Monday. Altcoins, including Ethereum (ETH) and Ripple (XRP), are following in BTC’s footsteps, experiencing relief rebounds following a volatile week.

How much can one month of soft inflation change the Fed’s mind?

One month of softer inflation data is rarely enough to shift Federal Reserve policy on its own, but in a market highly sensitive to every data point, even a single reading can reshape expectations. November’s inflation report offered a welcome sign of cooling price pressures. 

XRP rebounds amid ETF inflows and declining retail demand demand

XRP rebounds as bulls target a short-term breakout above $2.00 on Friday. XRP ETFs record the highest inflow since December 8, signaling growing institutional appetite.