AUD/USD Price Analysis: Battles previous support around 0.7150 on oversold RSI


  • AUD/USD prints mild gains, pokes intraday top to consolidate Friday’s losses.
  • September’s low, monthly resistance line also challenges recovery moves.
  • 0.7000-6990 appears a tough nut to crack for the bears.

AUD/USD challenges intraday high around 0.7145, up 0.10% on a day during early Monday. In doing so, the Aussie pair keeps late Friday’s bounce off a three-month low to challenge the yearly support-turned-resistance.

Given the oversold RSI conditions, the latest corrective pullback is likely to cross the 0.7150 immediate hurdle. However, September’s low and a descending trend line from November 02, around 0.7170 and 0.7230 respectively, will challenge the recovery moves.

Even if the AUD/USD bulls manage to cross the 0.7230 hurdle, July’s low and the mid-November’s swing high, close to 0.7290 and 0.7370 in that, will act as additional filters to the north for them to overcome.

Alternatively, the yearly low of 0.7105 remains in the spotlight during the fresh declines.

That said, the 38.2% Fibonacci retracement (Fibo.) of March 2020 to February 2021 run-up around 0.7050 and a horizontal area comprising multiple levels marked between June and November 2020, near 0.7000-6990, will be the key levels to follow the fall past-0.7105.

Overall, AUD/USD bears remain in the driver’s seat but the further downside has bumpy road.

AUD/USD: Daily chart

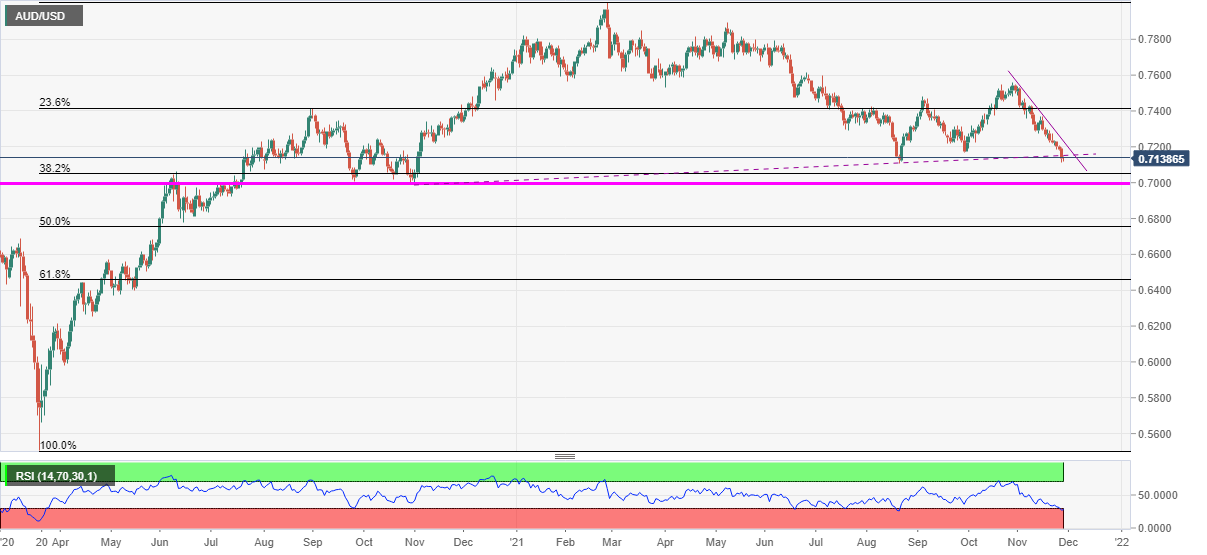
Trend: Further weakness expected

Additional important levels

Overview
Today last price 0.7142
Today Daily Change 0.0008
Today Daily Change % 0.11%
Today daily open 0.7134
 
Trends
Daily SMA20 0.7317
Daily SMA50 0.7342
Daily SMA100 0.7344
Daily SMA200 0.7519
 
Levels
Previous Daily High 0.7199
Previous Daily Low 0.7111
Previous Weekly High 0.7273
Previous Weekly Low 0.7111
Previous Monthly High 0.7557
Previous Monthly Low 0.7191
Daily Fibonacci 38.2% 0.7145
Daily Fibonacci 61.8% 0.7166
Daily Pivot Point S1 0.7097
Daily Pivot Point S2 0.7061
Daily Pivot Point S3 0.701
Daily Pivot Point R1 0.7185
Daily Pivot Point R2 0.7236
Daily Pivot Point R3 0.7272


Share: Feed news

Information on these pages contains forward-looking statements that involve risks and uncertainties. Markets and instruments profiled on this page are for informational purposes only and should not in any way come across as a recommendation to buy or sell in these assets. You should do your own thorough research before making any investment decisions. FXStreet does not in any way guarantee that this information is free from mistakes, errors, or material misstatements. It also does not guarantee that this information is of a timely nature. Investing in Open Markets involves a great deal of risk, including the loss of all or a portion of your investment, as well as emotional distress. All risks, losses and costs associated with investing, including total loss of principal, are your responsibility. The views and opinions expressed in this article are those of the authors and do not necessarily reflect the official policy or position of FXStreet nor its advertisers. The author will not be held responsible for information that is found at the end of links posted on this page.

If not otherwise explicitly mentioned in the body of the article, at the time of writing, the author has no position in any stock mentioned in this article and no business relationship with any company mentioned. The author has not received compensation for writing this article, other than from FXStreet.

FXStreet and the author do not provide personalized recommendations. The author makes no representations as to the accuracy, completeness, or suitability of this information. FXStreet and the author will not be liable for any errors, omissions or any losses, injuries or damages arising from this information and its display or use. Errors and omissions excepted.

The author and FXStreet are not registered investment advisors and nothing in this article is intended to be investment advice.

Recommended content


Recommended content

Editors’ Picks

EUR/USD climbs to 10-day highs above 1.0700

EUR/USD climbs to 10-day highs above 1.0700

EUR/USD gained traction and rose to its highest level in over a week above 1.0700 in the American session on Tuesday. The renewed US Dollar weakness following the disappointing PMI data helps the pair stretch higher.

EUR/USD News

GBP/USD extends recovery beyond 1.2400 on broad USD weakness

GBP/USD extends recovery beyond 1.2400 on broad USD weakness

GBP/USD gathered bullish momentum and extended its daily rebound toward 1.2450 in the second half of the day. The US Dollar came under heavy selling pressure after weaker-than-forecast PMI data and fueled the pair's rally. 

GBP/USD News

Gold struggles around $2,325 despite broad US Dollar’s weakness

Gold struggles around $2,325 despite broad US Dollar’s weakness

Gold reversed its direction and rose to the $2,320 area, erasing a large portion of its daily losses in the process. The benchmark 10-year US Treasury bond yield stays in the red below 4.6% following the weak US PMI data and supports XAU/USD.

Gold News

Here’s why Ondo price hit new ATH amid bearish market outlook Premium

Here’s why Ondo price hit new ATH amid bearish market outlook

Ondo price shows no signs of slowing down after setting up an all-time high (ATH) at $1.05 on March 31. This development is likely to be followed by a correction and ATH but not necessarily in that order.

Read more

Germany’s economic come back

Germany’s economic come back

Germany is the sick man of Europe no more. Thanks to its service sector, it now appears that it will exit recession, and the economic future could be bright. The PMI data for April surprised on the upside for Germany, led by the service sector.

Read more

Forex MAJORS

Cryptocurrencies

Signatures