|

AUD/USD dribbles back from Fed rally peak at 0.6580

  • AUD/USD tested into nine-day high after Fed knocked the Greenback lower.
  • Soft Aussie GDP limits gains as markets await another Fed outing.
  • US NFP Friday still looms over the horizon.

AUD/USD knocked into a two-week high near 0.6580 after Federal Reserve (Fed) Chairman Jerome Powell kicked the legs out from underneath the US Dollar (USD) on Wednesday. Fed Chair Powell noted that the Fed doesn’t see increased risk of an economic recession in the US this year while testifying before the US Congressional House Financial Services Committee. The head of the US central bank is expected to deliver further comments on Thursday when he appears for day two of the Fed’s Semi-Annual Monetary Policy Report.

Jerome Powell Speech: Fed Chair says they are not climate change policymakers

Australia’s latest Gross Domestic Product (GDP) print early Wednesday capped gains for the Aussie (AUD), coming in below market expectations to print at 0.2% for the fourth quarter compared to the previous quarter’s 0.3%, which was revised slightly higher from 0.2%. Australia’s Trade Balance for February lands early Thursday at 00:30 GMT, and is expected to print at 11.5 billion after the previous month’s 10.959 billion.

China’s Trade Balance (in USD terms) is also expected early Thursday at 03:00 GMT, and is expected to drive market sentiment in the Asia market session. China’s USD-denominated Trade Balance for February is forecast to jump to $103.7 billion versus January’s $75.34 billion on mixed trade results. Chinese Imports are expected to climb 1.5% versus the previous 0.2%, while Exports growth is expected to slow to 1.9% from the previous 2.3%.

Friday’s US Nonfarm Payrolls (NFP) will wrap up the trading week, and markets are expecting the key jobs data to print at 200K for February compared to January’s 11-month high of 353K.

AUD/USD technical outlook

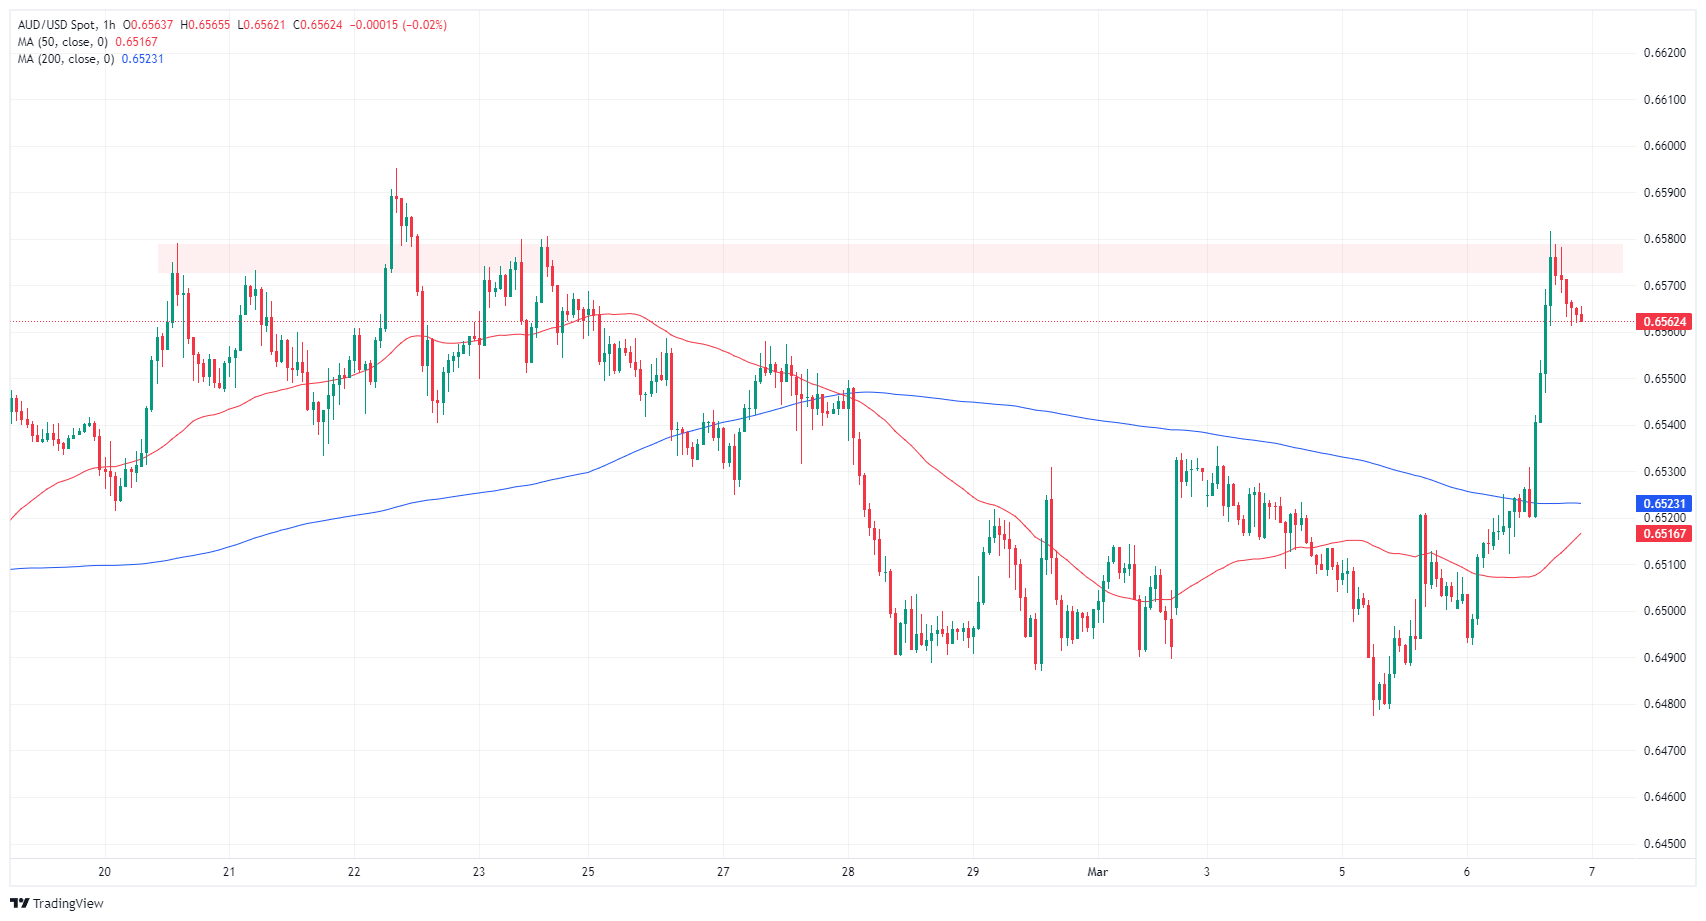
The AUD/USD climbed into a familiar technical resistance zone near 0.6580 before facing a rejection, dragging the pair back into 0.6560 and keeping the Aussie hung up in a thin chart region in the near-term.

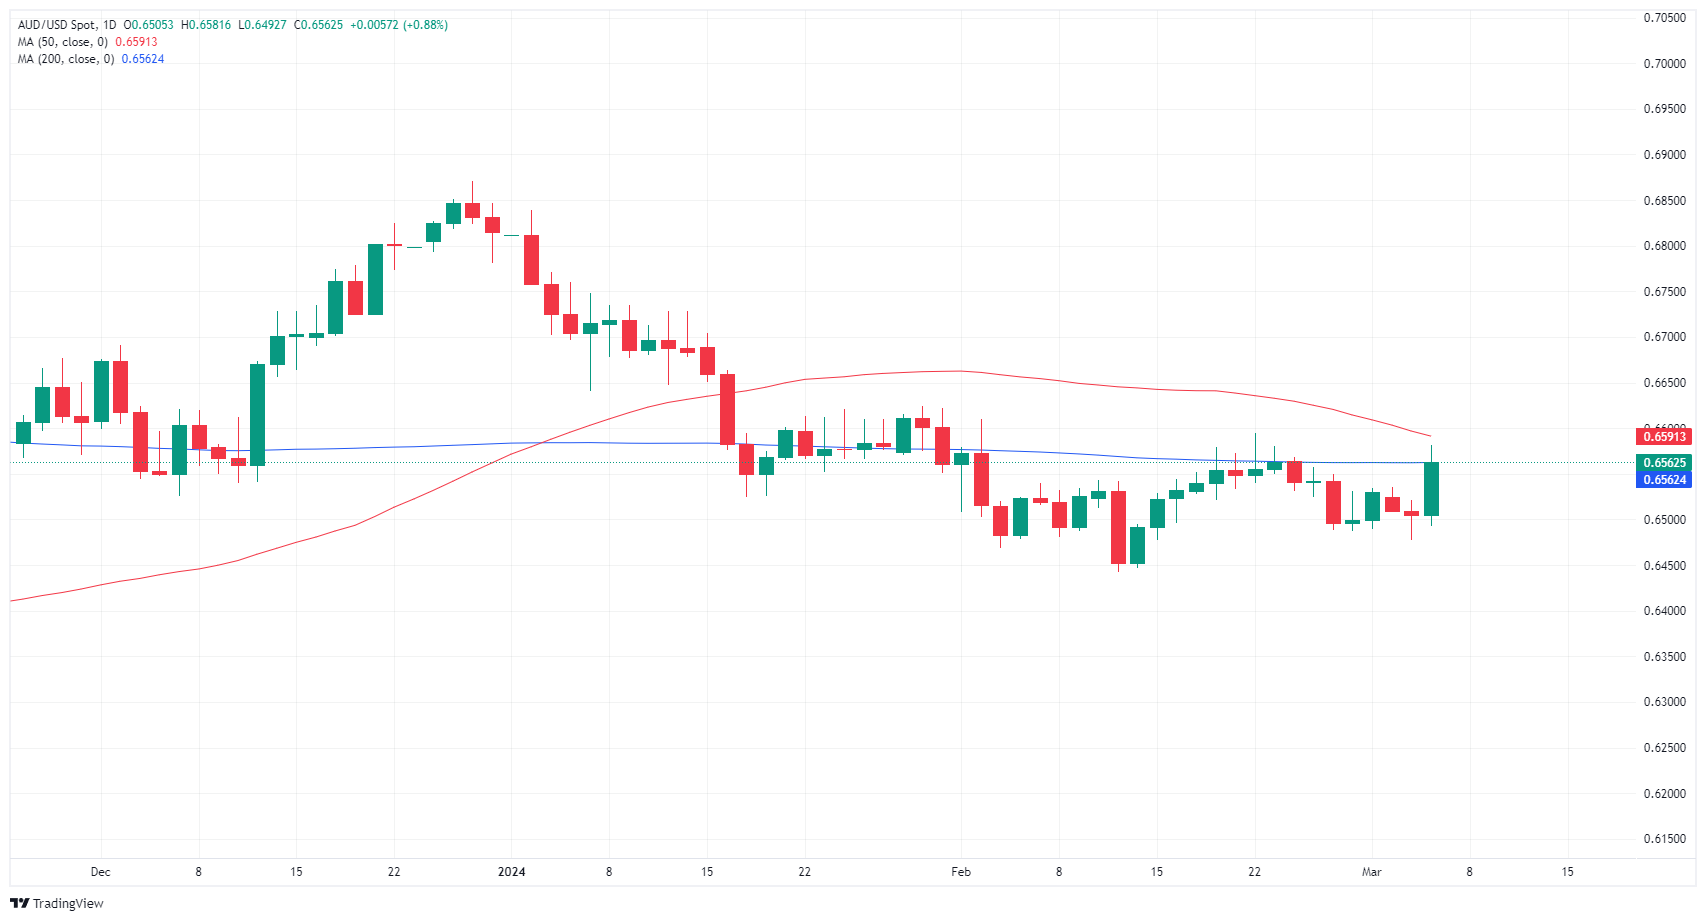
Wednesday’s bullish candle represents one of the pair’s strongest performances since December, but the pair has run into a technical ceiling at the 200-day Simple Moving Average (SMA) near 0.6560, and bullish momentum is set to falter back into the 0.6500 handle is sellers return to the fold.

AUD/USD hourly chart
AUD/USD daily chart
AUD/USD

Overview
Today last price0.6562
Today Daily Change0.0057
Today Daily Change %0.88
Today daily open0.6505
 
Trends
Daily SMA200.6523
Daily SMA500.6597
Daily SMA1000.6564
Daily SMA2000.6562
 
Levels
Previous Daily High0.6521
Previous Daily Low0.6478
Previous Weekly High0.6569
Previous Weekly Low0.6487
Previous Monthly High0.661
Previous Monthly Low0.6443
Daily Fibonacci 38.2%0.6494
Daily Fibonacci 61.8%0.6504
Daily Pivot Point S10.6482
Daily Pivot Point S20.6458
Daily Pivot Point S30.6438
Daily Pivot Point R10.6525
Daily Pivot Point R20.6545
Daily Pivot Point R30.6569

Author

Joshua Gibson

Joshua joins the FXStreet team as an Economics and Finance double major from Vancouver Island University with twelve years' experience as an independent trader focusing on technical analysis.


More from Joshua Gibson
Share:

Editor's Picks

AUD/USD pulls back from monthly high but holds above 0.7000

AUD/USD retreats from the monthly high set earlier this Thursday, sliding back to 0.7000 during the Asian session as a further escalation of tensions in the Middle East undermines the risk-sensitive Aussie. However, recent hawkish comments from RBA officials could support the Australian Dollar. Furthermore, the prevailing US Dollar selling bias, despite Fed hike bets and geopolitical uncertainties, could limit losses for the pair.

USD/JPY declines to a one-week low; eyes trading range support near 157.50 on weaker USD

USD/JPY drops to a one-week low during Thursday’s Asian session, with bears now awaiting a break below multi-week range support near mid-157.00s before placing fresh bets amid a broadly weaker US Dollar. Despite bets for a December Fed rate hike and Middle East jitters, the recent decline in US bond yields keeps USD depressed near a three-week low. Moreover, hawkish BoJ expectations and intervention risks underpin the Japanese Yen, further weighing on the currency pair.

Gold weakens to near $4,110 amid broader strength in oil prices

Gold is down 1% to near $4,095 in the Asian trading session on Thursday on the back of fears that global inflation expectations could accelerate further due to heightened geopolitical tensions in the Middle East.


XRP and XLM recovery stalls below EMAs
Ripple (XRP) and Stellar (XLM) remain under pressure on Thursday as both struggle to sustain their recent recovery attempts. XRP trades below $1.36, while XLM slips beneath $0.183, as mixed derivatives metrics, weakening momentum indicators and heating market conditions suggest cautious market sentiment. Derivatives data shows weakening conditions for Ripple and Stellar.
The US Oil reserve hit a 44-year low. Now the barrels are coming back

Washington lent out a third of the Strategic Petroleum Reserve this year rather than selling it. The loans come due from now to 2029, and after the midterms, the reserve has nothing left to hold fuel prices down. The US Strategic Petroleum Reserve held 282.7 million barrels in the week to October 16, down another 300K, and lower than at any point since October 1982.

The US Dollar fell. Gold didn't rally. That tells you everything
Gold (XAU/USD) is struggling to capitalize on a weaker US Dollar (USD), after repeatedly failing to establish itself above the $4,200 level. The precious metal remains confined to a relatively narrow trading range despite a combination of developments that would normally support higher prices.