AUD/NZD Price Analysis: Breaks seven-week-old support on hawkish RBNZ


  • AUD/NZD marks the heaviest daily loss since late May as RBNZ hints at tapering.
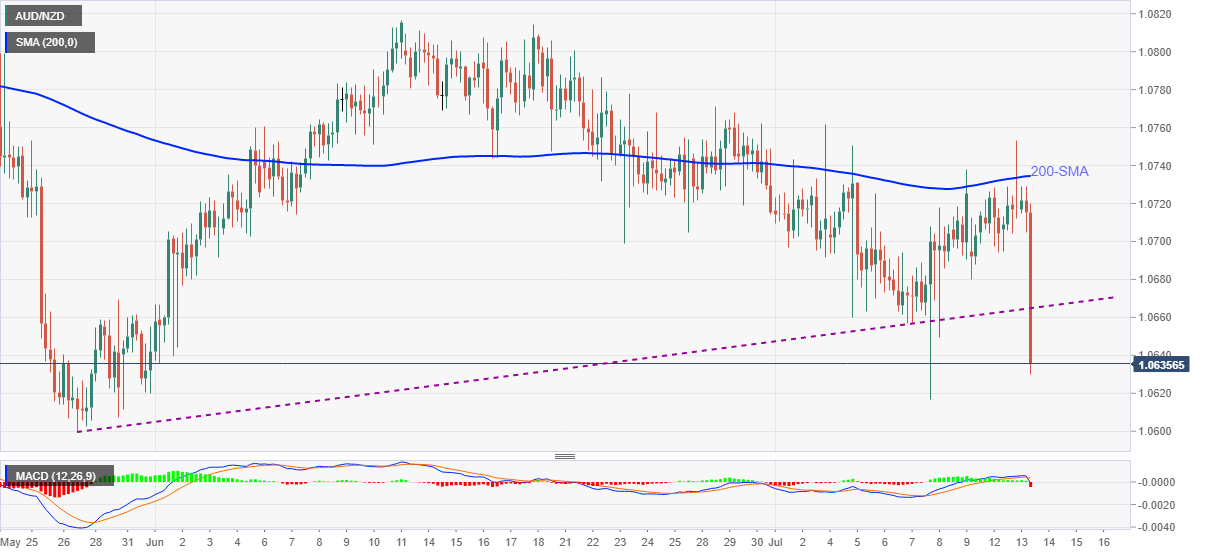
  • Clear U-turn from 200-DMA, bearish MACD and downside break of short-term key support also favor bears.

AUD/NZD slumps around 70 pips to recently around 1.0640, down 0.74% intraday, following the RBNZ meeting on early Wednesday. In doing so, the cross-currency pair drops the most since May 26 while breaking a nearby ascending support line, now resistance.

RBNZ announces tapering of bond purchases during late July while matching wide market expectations of no rate hike in its latest monetary policy update.

Read: Breaking: RBNZ leaves official cash rate unchanged at 0.25% as expected

Given the MACD turning most bearish in nearly two months, the trend line breakdown and sustained U-turn from 200-SMA directs AUD/NZD towards the May month’s low surrounding 1.0600 threshold.

It should, however, be noted that the quote needs to close below the late February’s low of 1.0638 to aim for 1.0600, else a corrective pullback towards the previous support line near 1.0665 can’t be ruled out.

In a case where the AUD/NZD prices remain weak below 1.0600, the yearly low marked in February around 1.0540 will be the key to watch.

Meanwhile, corrective pullback beyond the recently broken support line, around 1.0665, will again aim for a 200-SMA level of 1.0734. Though, the bulls are less likely to be convinced until the pair rises past June 28 top surrounding 1.0770.

AUD/NZD: Four-hour chart

Trend: Further downside expected

Additional important levels

Overview
Today last price 1.0653
Today Daily Change -0.0066
Today Daily Change % -0.62%
Today daily open 1.0719
 
Trends
Daily SMA20 1.0735
Daily SMA50 1.0739
Daily SMA100 1.0767
Daily SMA200 1.072
 
Levels
Previous Daily High 1.0753
Previous Daily Low 1.0694
Previous Weekly High 1.075
Previous Weekly Low 1.0617
Previous Monthly High 1.0817
Previous Monthly Low 1.0622
Daily Fibonacci 38.2% 1.073
Daily Fibonacci 61.8% 1.0717
Daily Pivot Point S1 1.0691
Daily Pivot Point S2 1.0663
Daily Pivot Point S3 1.0632
Daily Pivot Point R1 1.075
Daily Pivot Point R2 1.0781
Daily Pivot Point R3 1.0809


Share: Feed news

Information on these pages contains forward-looking statements that involve risks and uncertainties. Markets and instruments profiled on this page are for informational purposes only and should not in any way come across as a recommendation to buy or sell in these assets. You should do your own thorough research before making any investment decisions. FXStreet does not in any way guarantee that this information is free from mistakes, errors, or material misstatements. It also does not guarantee that this information is of a timely nature. Investing in Open Markets involves a great deal of risk, including the loss of all or a portion of your investment, as well as emotional distress. All risks, losses and costs associated with investing, including total loss of principal, are your responsibility. The views and opinions expressed in this article are those of the authors and do not necessarily reflect the official policy or position of FXStreet nor its advertisers. The author will not be held responsible for information that is found at the end of links posted on this page.

If not otherwise explicitly mentioned in the body of the article, at the time of writing, the author has no position in any stock mentioned in this article and no business relationship with any company mentioned. The author has not received compensation for writing this article, other than from FXStreet.

FXStreet and the author do not provide personalized recommendations. The author makes no representations as to the accuracy, completeness, or suitability of this information. FXStreet and the author will not be liable for any errors, omissions or any losses, injuries or damages arising from this information and its display or use. Errors and omissions excepted.

The author and FXStreet are not registered investment advisors and nothing in this article is intended to be investment advice.

Recommended content


Recommended content

Editors’ Picks

EUR/USD climbs to 10-day highs above 1.0700

EUR/USD climbs to 10-day highs above 1.0700

EUR/USD gained traction and rose to its highest level in over a week above 1.0700 in the American session on Tuesday. The renewed US Dollar weakness following the disappointing PMI data helps the pair stretch higher.

EUR/USD News

GBP/USD extends recovery beyond 1.2400 on broad USD weakness

GBP/USD extends recovery beyond 1.2400 on broad USD weakness

GBP/USD gathered bullish momentum and extended its daily rebound toward 1.2450 in the second half of the day. The US Dollar came under heavy selling pressure after weaker-than-forecast PMI data and fueled the pair's rally. 

GBP/USD News

Gold rebounds to $2,320 as US yields turn south

Gold rebounds to $2,320 as US yields turn south

Gold reversed its direction and rose to the $2,320 area, erasing a large portion of its daily losses in the process. The benchmark 10-year US Treasury bond yield stays in the red below 4.6% following the weak US PMI data and supports XAU/USD.

Gold News

Here’s why Ondo price hit new ATH amid bearish market outlook Premium

Here’s why Ondo price hit new ATH amid bearish market outlook

Ondo price shows no signs of slowing down after setting up an all-time high (ATH) at $1.05 on March 31. This development is likely to be followed by a correction and ATH but not necessarily in that order.

Read more

Germany’s economic come back

Germany’s economic come back

Germany is the sick man of Europe no more. Thanks to its service sector, it now appears that it will exit recession, and the economic future could be bright. The PMI data for April surprised on the upside for Germany, led by the service sector.

Read more

Forex MAJORS

Cryptocurrencies

Signatures