AUD/JPY technical analysis: Repeated failures to cross 50-day EMA highlights 4-week old support-line
- Lower highs since late-May, failures to clear near-term key moving average (MA), portrays the AUD/JPY pair’s weakness.
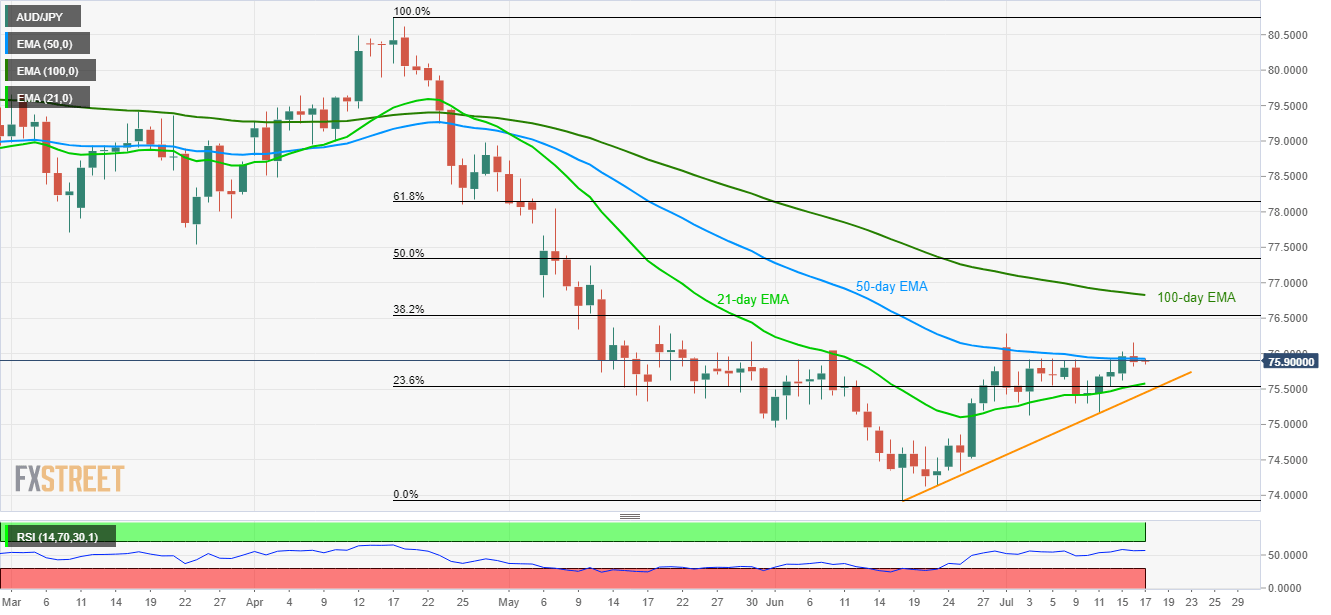
- Sellers can aim for 75.58/54 as immediate support ahead of targeting a month-long support-line.

With its another U-turn from the 50-day exponential moving average (EMA), AUD/JPY declines to 75.90 during the early Asian session on Wednesday.
As a result, 75.58/54 support-zone comprising 23.6% Fibonacci retracement of April – June downpour and 21-day EMA gains market attention. However, pair’s further declines can be challenged by an upward sloping trend-line stretched since June 18, at 75.45 now.
In a case where prices slip beneath 75.45, 74.80 and June month low near 73.92 could lure bears.
Alternatively, a successful break beyond 50-day EMA level of 75.93 can have multiple upside barriers around 76.20, 76.40 and 38.2% Fibonacci retracement level of 76.54.
It should, however, be noted that the quote’s sustained rise past 76.54 may not refrain from questioning the strength 76.83 resistance including 100-day EMA.
AUD/JPY daily chart
Trend: Pullback expected
Author

Anil Panchal
FXStreet
Anil Panchal has nearly 15 years of experience in tracking financial markets. With a keen interest in macroeconomics, Anil aptly tracks global news/updates and stays well-informed about the global financial moves and their implications.


