AUD/JPY Price Analysis: W-formation spotted on daily chart
- AUD/JPY bulls could be tiring at this juncture.
- The bears are looking to the W-formation's neckline as a target for the days ahead.

AUD/JPY has performed well on the bid this week and there could be more to go. However, the W-formation on the daily chart is a compelling feature that could play out in a downside correction for the days ahead.
AUD/JPY daily chart
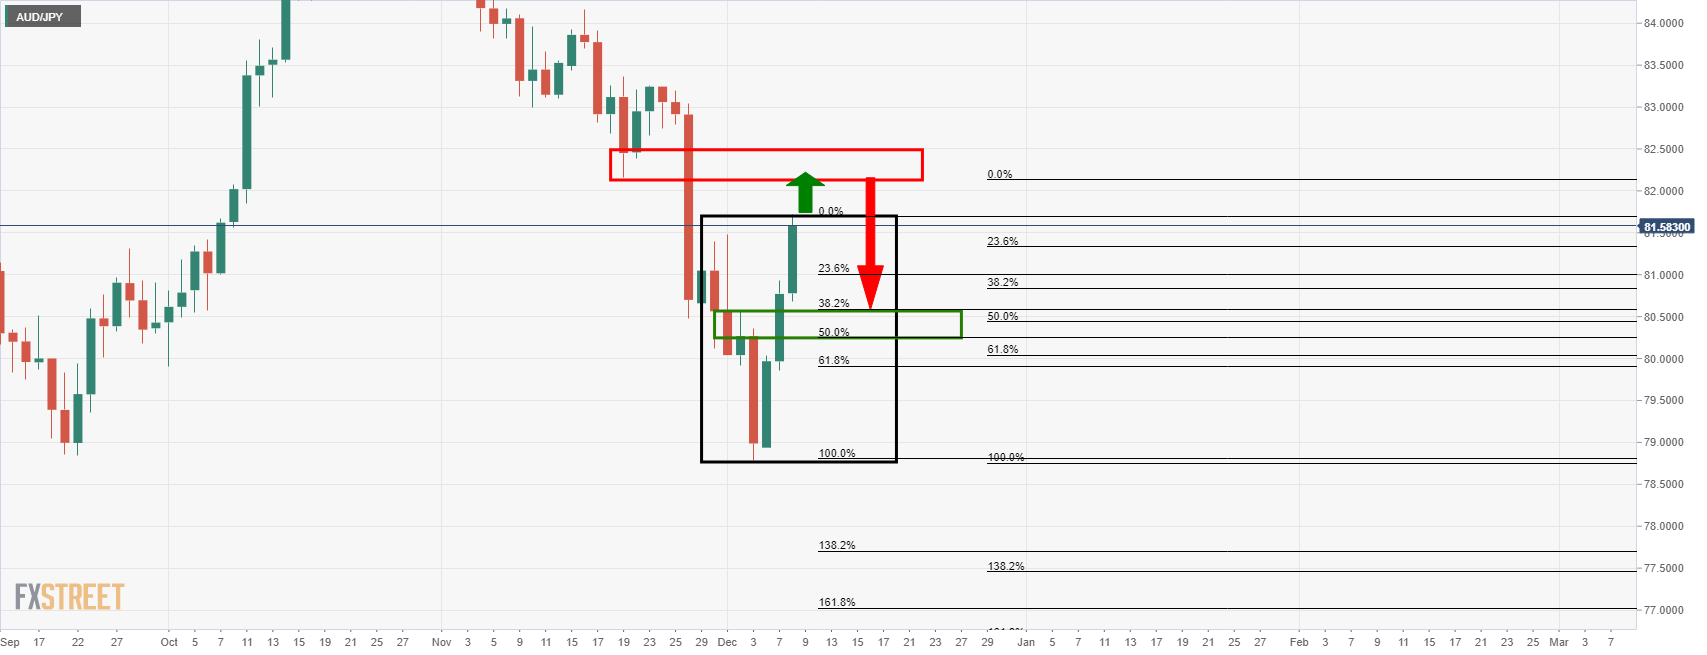
While there is room to go until the next presumed resistance area, around 82.1580, the price is leaving a W-formation. This is a reversion pattern that has a high completion rate in that the price would be expected to retreat in due course and restest the neckline of the W-pattern. This is between the wick of Dec 2 and the opening of the same candle 80.5630 and 80.2452.
AUD/JPY H1
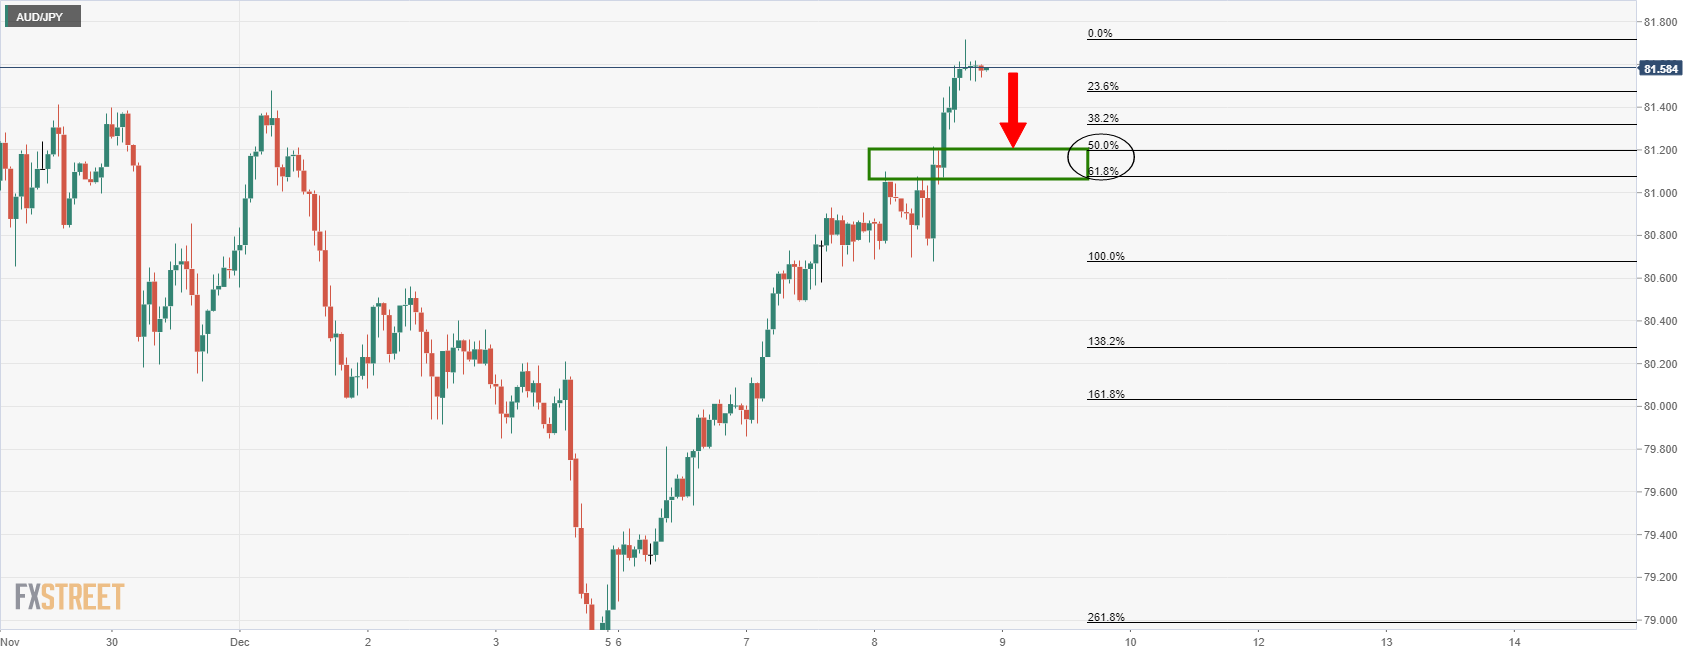
The hourly chart has a confluence between the old resistance structure and the 50% / 61.8% ratios on the downside. This would be expected to hold initial tests. However, a break there will open the prospects of a downside continuation to target the daily W-formation's neckline.
Author

Ross J Burland
FXStreet
Ross J Burland, born in England, UK, is a sportsman at heart. He played Rugby and Judo for his county, Kent and the South East of England Rugby team.


