|

AUD/JPY Price Analysis: Ignores China PMI to ease from immediate resistance line above 75.00

  • AUD/JPY sellers attack 75.00 after taking a U-turn from a three-day-old falling trend line.
  • China’s July month official PMIs flashed better than forecast data, Aussie PPI weakened for Q2.
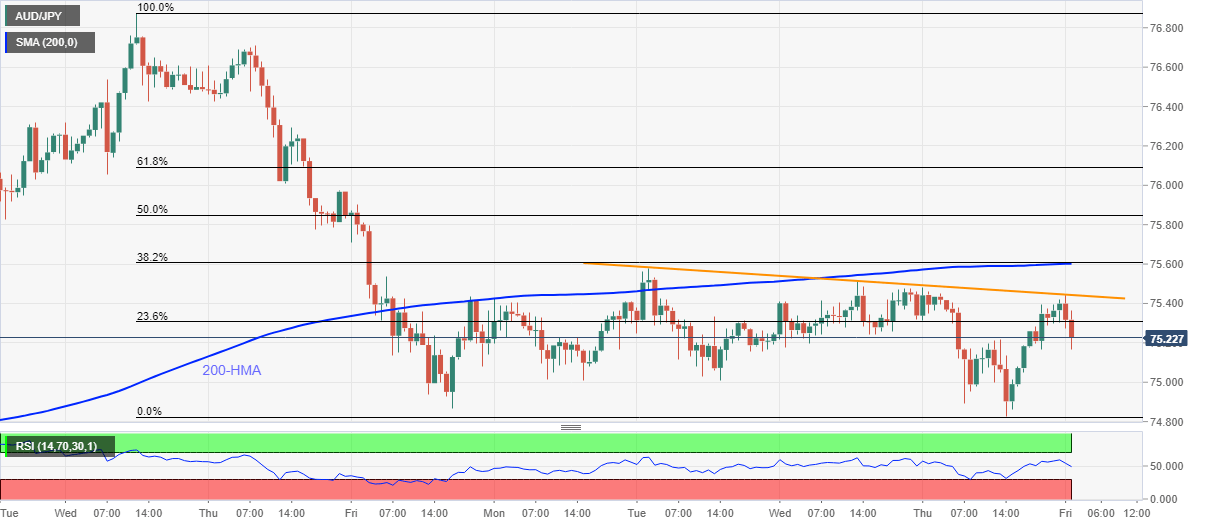
  • A confluence of 200-HMA, 38.2% Fibonacci retracement adds to the upside barriers.

AUD/JPY drops to 75.19, down 0.20% on a day, during the early Friday. The pair recently reacted to Australia’s Producer Price Index (PPI) data for the second quarter (Q2). In doing so, it ignores China’s PMI data for July.

Australia’s Q2 PPI slips below +1.3% YoY forecast and prior to -0.4% while the QoQ figures defy 0.3% market consensus and 0.2% previous readouts with -1.2% data. Earlier, China’s NBS Manufacturing PMI surged past-50.7 forecast and 50.9 earlier readings to 51.1 whereas Non-Manufacturing PMI crossed 51.2 expectations with 54.2 figures.

With the pair’s failure to cross the immediate resistance line, coupled with downbeat data at home and a broad risk-off, the AUD/JPY prices may continue staying pressures. As a result, 75.00 could lure the sellers ahead of highlighting the weekly bottom surrounding 74.80.

During the quote’s further weakness past-74.80, the monthly trough close to 73.90 will be in the spotlight.

On the contrary, 200-HMA and 38.2% Fibonacci retracement of July 22-30 fall, around 75.60 will act as additional resistance beyond the said falling trend line around 75.45.

Should the quote remains positive past-75.60, 61.8% Fibonacci retracement level of 76.10 could challenge the bulls.

AUD/JPY hourly chart

Trend: Bearish

Additional important levels

Overview
Today last price75.2
Today Daily Change-0.15
Today Daily Change %-0.20%
Today daily open75.35
 
Trends
Daily SMA2075.12
Daily SMA5074.24
Daily SMA10070.99
Daily SMA20072.5
 
Levels
Previous Daily High75.48
Previous Daily Low74.83
Previous Weekly High76.88
Previous Weekly Low74.82
Previous Monthly High76.79
Previous Monthly Low71.61
Daily Fibonacci 38.2%75.08
Daily Fibonacci 61.8%75.23
Daily Pivot Point S174.95
Daily Pivot Point S274.56
Daily Pivot Point S374.3
Daily Pivot Point R175.61
Daily Pivot Point R275.88
Daily Pivot Point R376.27

Author

Anil Panchal

Anil Panchal

FXStreet

Anil Panchal has nearly 15 years of experience in tracking financial markets. With a keen interest in macroeconomics, Anil aptly tracks global news/updates and stays well-informed about the global financial moves and their implications.

More from Anil Panchal
Share:

Markets move fast. We move first.

Orange Juice Newsletter brings you expert driven insights - not headlines. Every day on your inbox.

By subscribing you agree to our Terms and conditions.

Editor's Picks

EUR/USD recovers to 1.1750 region as 2025 draws to a close

Following the bearish action seen in the European session on Wednesday, EUR/USD regains its traction and recovery to the 1.1750 region. Nevertheless, the pair's volatility remains low as trading conditions thin out on the last day of the year.

GBP/USD stays weak near 1.3450 on modest USD recovery

GBP/USD remains under modest beairsh pressure and fluctuates at around 1.3450 on Wednesday. The US Dollar finds fresh demand due to the end-of-the-year position adjustments, weighing on the pair amid the pre-New Year trading lull. 

Gold retreats to $4,300 area, looks to post monthly gains

Gold stays on the back foot on the last day of 2025 and trades near $4,300, possibly pressured by profit-taking and position adjustments. Nevertheless, XAU/USD remains on track to post gains for December and extend its winning streak into a fifth consecutive month.

Bitcoin, Ethereum and XRP prepare for a potential New Year rebound

Bitcoin, Ethereum, and Ripple are holding steady on Wednesday after recording minor gains on the previous day. Technically, Bitcoin could extend gains within a triangle pattern while Ethereum and Ripple face critical overhead resistance. 

Economic outlook 2026-2027 in advanced countries: Solidity test

After a year marked by global economic resilience and ending on a note of optimism, 2026 looks promising and could be a year of solid economic performance. In our baseline scenario, we expect most of the supportive factors at work in 2025 to continue to play a role in 2026.

Crypto market outlook for 2026

Year 2025 was volatile, as crypto often is.  Among positive catalysts were favourable regulatory changes in the U.S., rise of Digital Asset Treasuries (DAT), adoption of AI and tokenization of Real-World-Assets (RWA).