|

AUD/JPY Price Analysis: Forms a doji around 4-month high, ahead of RBA’s decision

  • AUD/JPY experiences a risk-off impulse amid decelerating US business activity and RBA’s monetary policy.
  • Despite a lingering upward bias, market sentiment may shift due to the pair’s sensitivity to risk changes, potentially leading to violent swings.
  • A balance of technical indicators suggests that AUD/JPY could target a lower range, with resistance remaining at the four-month and year-to-date highs.

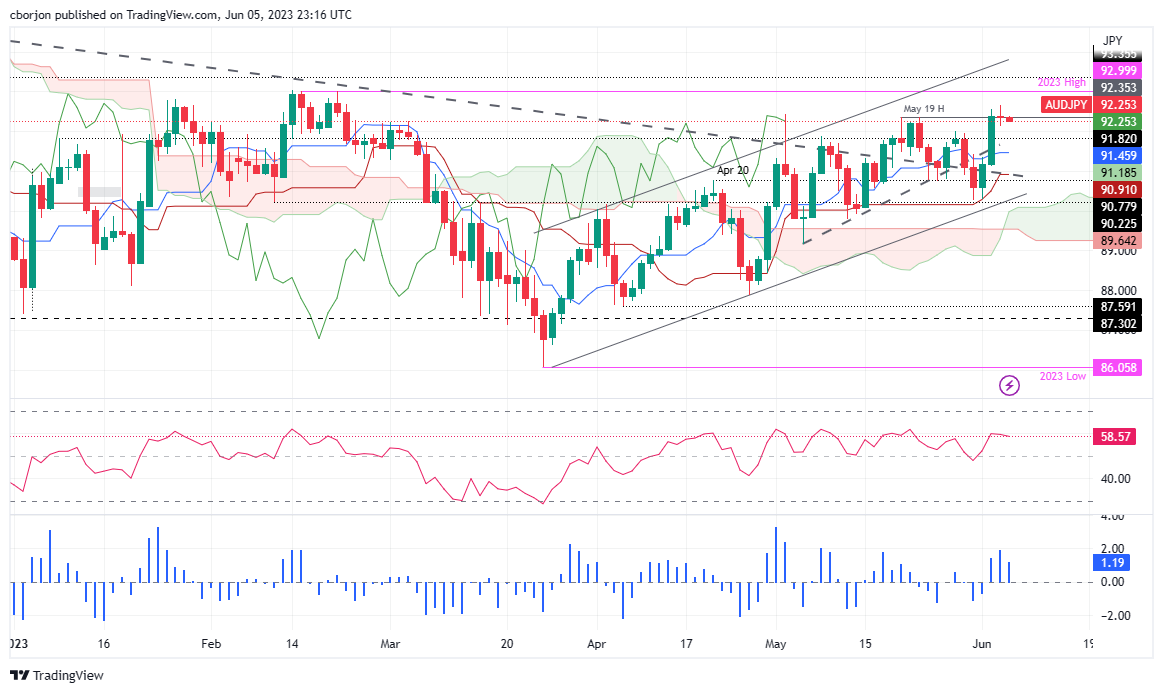
AUD/JPY forms a doji, as shown by the daily chart, after hitting a fresh four-month high at 92.66, hovering nearby the 92.30s area, after trading within the 9213/66 range on Monday. A risk-off impulse was the main reason behind price action, with US business activity decelerating, while expectations for the Reserve Bank of Australia (RBA) to keep unchanged its interest rates at the upcoming monetary policy on Tuesday pressures the Aussie (AUD).

AUD/JPY Price Analysis: Technical outlook

From a daily chart perspective, the AUD/JPY is still upward biased, but given the nature of being used as a currency pair that reflects market sentiment, a risk-off impulse could shift the bias of the AUD/JPY. As long as the AUD/JPY remains above the Ichimoku cloud, the pair is upwards, but the Chikou Span, piercing May 2 candlestick chart at around 92.25, could trigger a sell signal, which could lower the price.

The Relative Strength Index (RSI) indicator is still bullish, but the three days Rate of Change (RoC) portrays that buying pressure is easing. Therefore, the AUD/JPY could aim toward the Tenkan-Sen Line at 91.46, as an initial target, in the near term, followed by the confluence of a support trendline and the Kijun Sen at 90.91.

Conversely, the AUD/JPY first resistance would be the four-month high at 92.66 before testing the YTD high at 92.99. A breach of the latter will expose the last year’s YTD high of 98.59.

AUD/JPY Price Action – Daily chart

AUD/JPY Daily chart

AUD/JPY

Overview
Today last price92.29
Today Daily Change-0.22
Today Daily Change %-0.24
Today daily open92.51
 
Trends
Daily SMA2091.34
Daily SMA5090.15
Daily SMA10090.45
Daily SMA20091.83
 
Levels
Previous Daily High92.56
Previous Daily Low91.1
Previous Weekly High92.56
Previous Weekly Low90.26
Previous Monthly High92.44
Previous Monthly Low89.16
Daily Fibonacci 38.2%92
Daily Fibonacci 61.8%91.66
Daily Pivot Point S191.55
Daily Pivot Point S290.59
Daily Pivot Point S390.08
Daily Pivot Point R193.02
Daily Pivot Point R293.52
Daily Pivot Point R394.48

Author

Christian Borjon Valencia

Markets analyst, news editor, and trading instructor with over 14 years of experience across FX, commodities, US equity indices, and global macro markets.

More from Christian Borjon Valencia
Share:

Editor's Picks

EUR/USD holds gains around 1.1800 amid renewed USD selling

EUR/USD regains positive traction and holds around 1.1800 in the European session, reversing the previous day's modest losses. The pair's uptick is sponsored by the emergence of fresh US Dollar selling, which remains induced by persistent trade-related uncertainties. 

GBP/USD strengthens above 1.3500 on softer US Dollar

GBP/USD is posting moderate gains above 1.3500 in European trading on Wednesday. The pair appreciates as the US Dollar meets fresh supply following US President Donald Trump’s first State of the Union address and amid looming tariff uncertainty. 

Gold eyes monthly top above $5,200 amid geopolitics, trade jitters

Gold buyers are back in the game, eyeing $5,200 and beyonf on Wednesday after seeing a correction from monthly highs on Tuesday. The US Dollar slips after Trump’s SOTU fails to impress and as AI-driven worries ease. Dovish Fed bets also weigh.  Gold looks north so long as the key 61.8% Fibo resistance at $5,142 holds on the daily chart.

Bitcoin, Ethereum and Ripple post cautious recovery amid downside risks

Bitcoin, Ethereum, and Ripple are posting a cautious recovery on Wednesday following a market correction earlier this week.  BTC is approaching a key breakdown level, while ETH and XRP are rebounding from crucial support levels.

The Citrini report: How a debatable AI narrative can shake Wall Street

That AI-related headline alone was enough to rattle investors.US stocks slid sharply on Monday after a widely circulated Citrini Research memo outlined a hypothetical “2028 Global Intelligence Crisis”, warning that rapid AI adoption could push US unemployment into double digits as early as by mid-2028.

Cosmos Hub Price Forecast: ATOM rebounds slightly, bearish outlook remains intact

Cosmos Hub (ATOM) price rebounds, trading above $2.05 at the time of writing on Wednesday, after undergoing a sharp correction since last week. Weakening on-chain and derivatives data support a bearish outlook, while technical analysis remains unfavorable.