AUD/JPY Price Analysis: Bears looking for monthly weekly and daily bearish confluence
- AUD/JPY is an attractive short below the daily structure.
- Currently, the stars do not quite align across all time frames from a top-down market structure analysis.

The Monthly is bearish and is looking as though it wants to form a head and shoulders.
The weekly is proving that there is resistance that first needs to hold the bullish commitments at this juncture.
The daily chart has a strong bullish bias while holding above a strong support structure along with the ascending trendline support.
Monthly chart
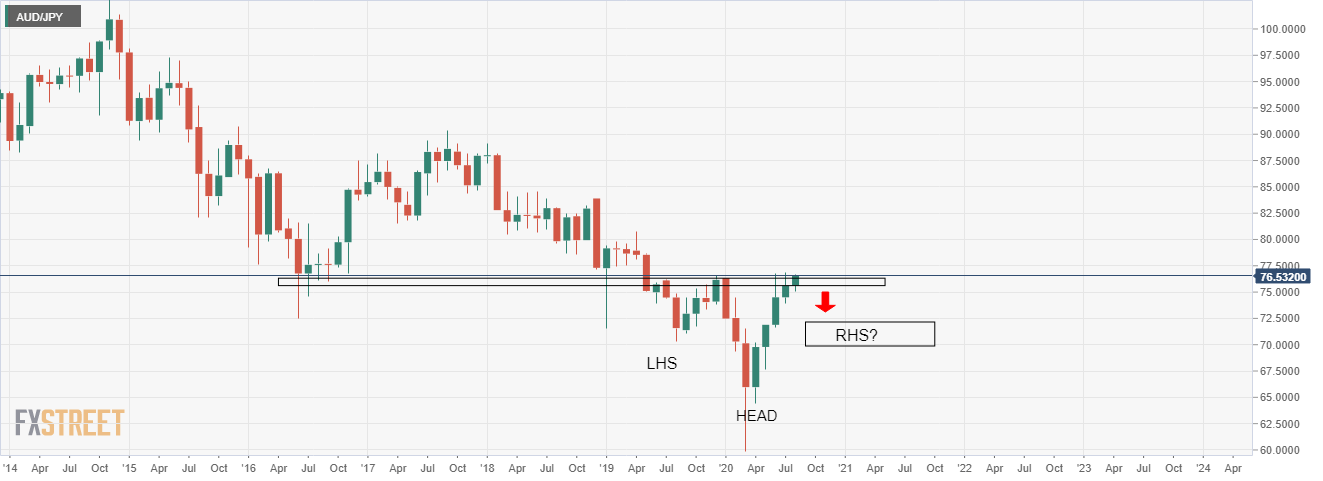
The above chart shows a potential reversal head and shoulders pattern in the making, offering downside target opportunities for the bears.
Weekly chart
-637328739489417800.png&w=1536&q=95)
The weekly chart is showing that the bulls are trying for a second attempt a the resistance. Should they fail, the prospects for the head and shoulders are sound.
Daily chart
-637328739691301583.png&w=1536&q=95)
The daily support structure is a confluence of higher lows, the support trendline and a restest of the structure which confirms a bullish bias.
-637328741561982789.png&w=1536&q=95)
However, should the same confluence breakdown, then bears will be looking to take over in the barroom brawl zone and a shorting opportunity on a retest of broken support structure turned resistance.
Author

Ross J Burland
FXStreet
Ross J Burland, born in England, UK, is a sportsman at heart. He played Rugby and Judo for his county, Kent and the South East of England Rugby team.


