Apple (AAPL) Stock Price and Forecast: Will Apple slump continue?
- Apple stock ends Monday 2.14% down amid risk aversion.
- AAPL breaks trend line support in place since July.
- Apple and markets are turning increasingly bearish.

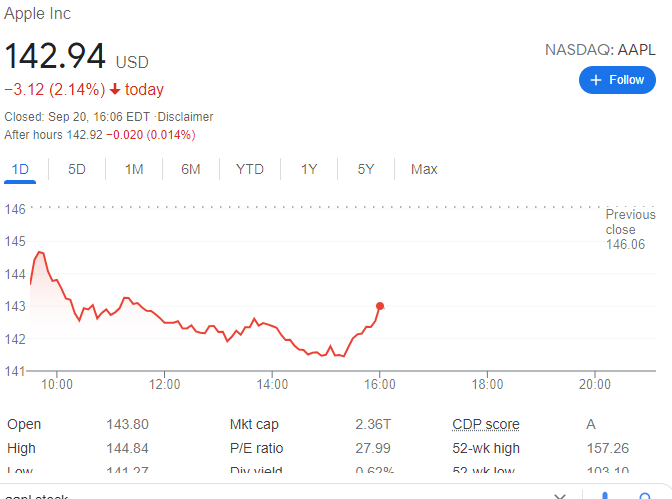
Update: Apple finished the first day of the week at $142.94 per share, down 2.14$. Stocks markets plummeted on the back of fears, as a Chinese property giant may fall into default, jeopardizing the country's financial system. Wall Street posted sharp losses, although the three major indexes managed to bounce from intraday lows ahead of the close. The Nasdaq Composite shed 303 points, while the DJIA closed 614 points lower. The S&P 500 lost 1.85%.
Apple stock lost more ground on Friday as the market turned negative and sentiment continues to look more to further losses. Worries about Chinese tech and regulation are hitting some Nasdaq stocks, and Apple is getting hit by association. Also, China is in the crosshairs due to the ongoing worries over property developer Evergrande, and this is also weighing on sentiment. The Fed tapering is also high on investors' worry list. Given Apple's size, if the broad market turns lower, it is likely Apple will too. Quadruple witching may also have had something to do with the weakness in equities as the expiry of single stock futures and options and index futures and options came on Friday at the close. Given this has been a strong quarter, some reversal into witching was possible.
-637677229887220540.png)
Apple 15-minute chart
We can see from the intraday chart above how Apple opened weaker and then just remained steady for the remainder of the session. In the process, though Apple broke the trend line support in place since July.
Apple key statistics
| Market Cap | $2.4 trillion |
| Enterprise Value | $2.3 trillion |
| Price/Earnings (P/E) | 29 |
|
Price/Book | 38 |
| Price/Sales | 9 |
| Gross Margin | 41% |
| Net Margin | 25% |
| EBITDA | $112 billion |
| 52 week low | $103.10 |
| 52 week high | $157.26 |
| Average Wall Street rating and price target |
Buy $166.7 |
Apple stock forecast
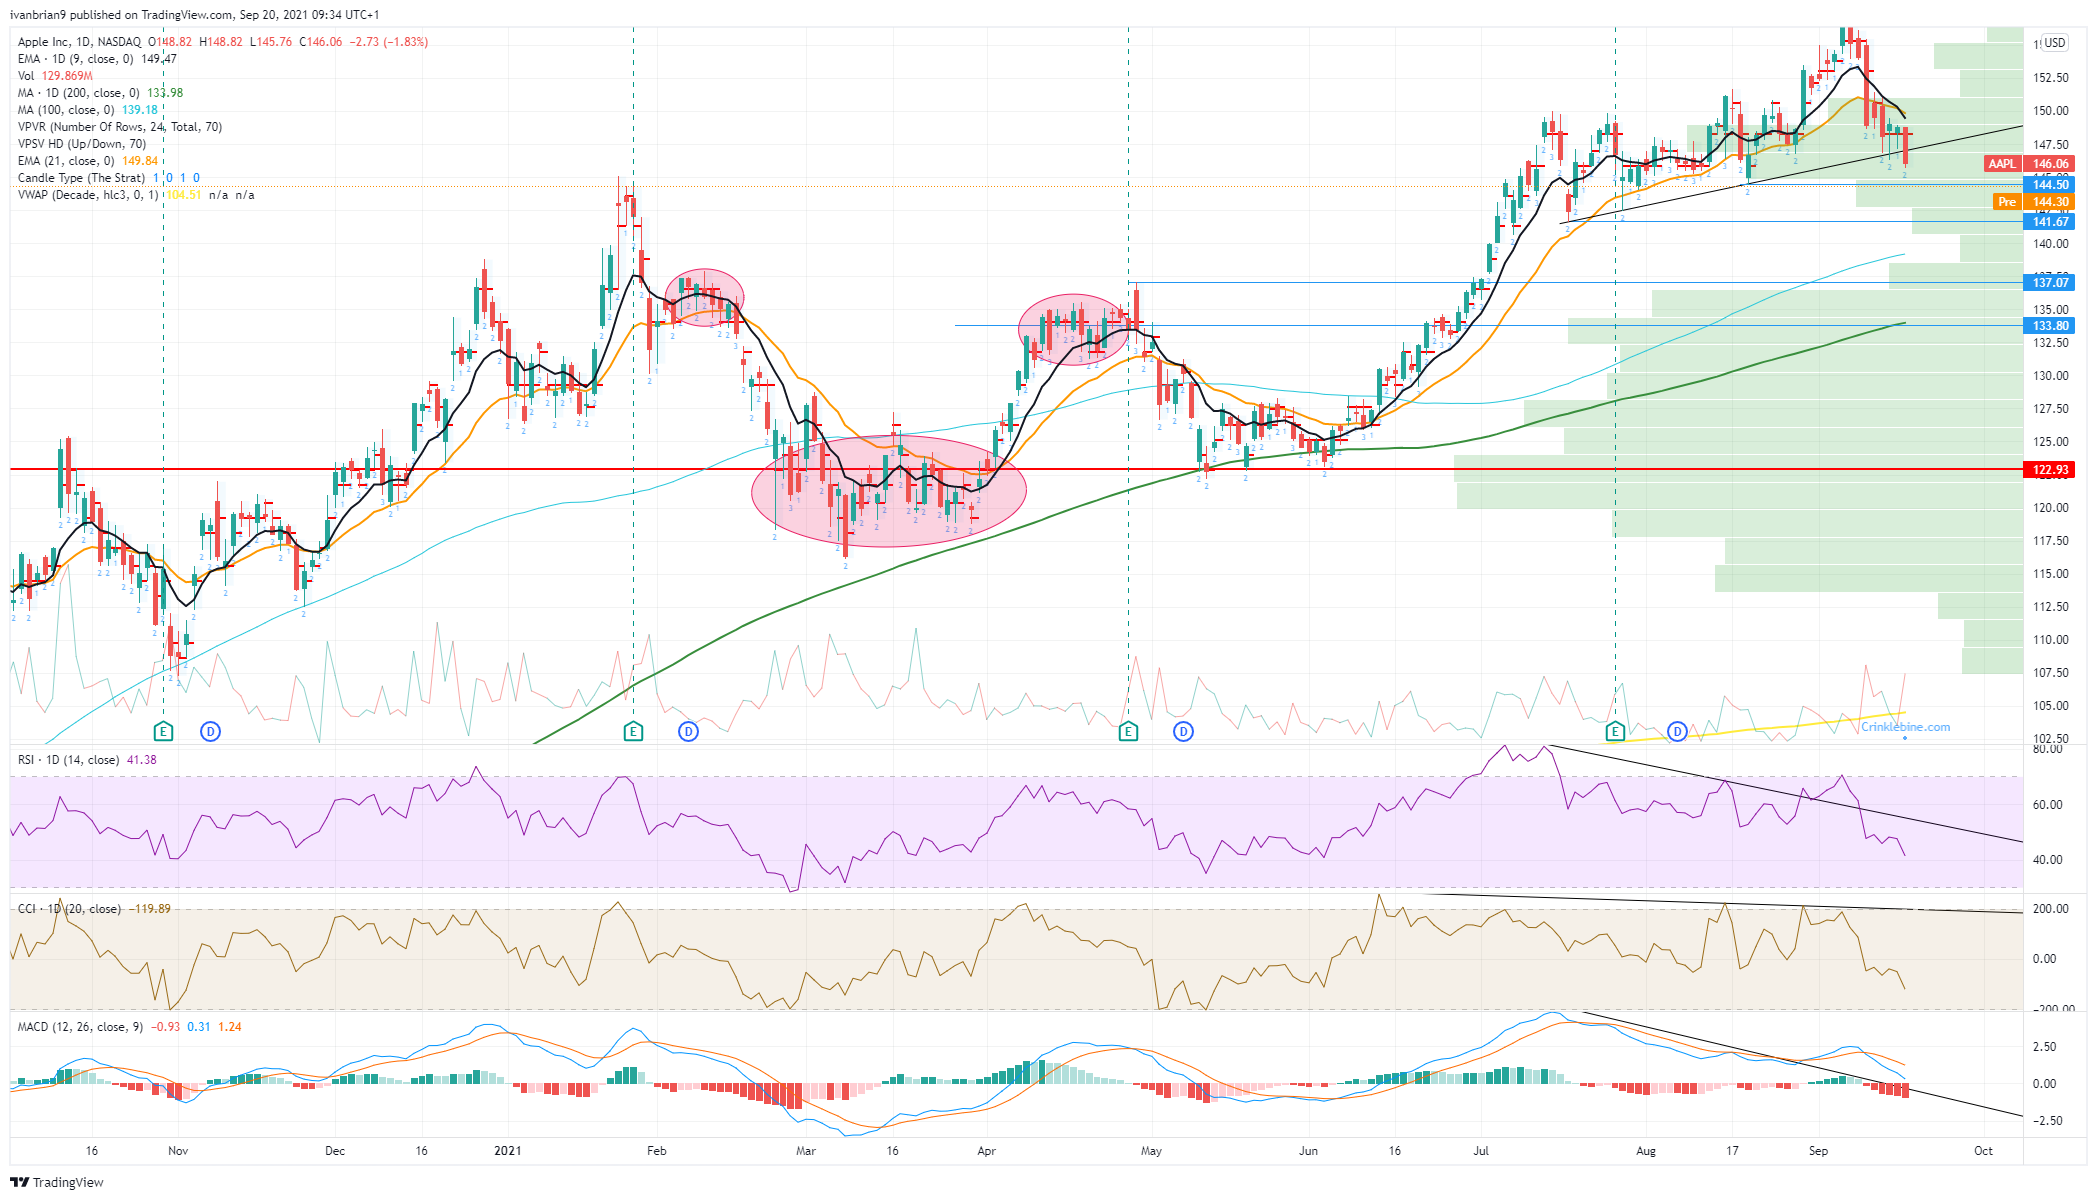
Apple is getting dangerously close to our bearish zone below $144.50. This is the low from August, and below $144.50 the volume profile thins out quite noticeably, meaning that price support is limited. Breaking $144.50 means we wait for support at $134 before thinking about entering the stock again. Momentum oscillators, the Relative Strength Index (RSI) and the Moving Average Convergence Divergence (MACD) are all pointing lower and trending down in confirmation of price action. Markets in Europe are already down nearly 2%, so this may be the day we turn bearish on Apple stock with a break of $144.50. Unless something interesting happens between now and the open of the US main session, we are going to break $144.50.
There are some potential option plays to make here as a break of $144.50 may lead to a sudden price fall due to the lack of volume support. In turn, a one to two-week $135 strike put or something like that may see a sharp price move. A $135 put for October 2 is trading around $0.43 cents.
FXStreet View: Neutral, bearish on a break of $144.50, bullish above $155.
FXStreet Trade Ideas: Buy zone at $134. Buy a short-dated put on a break of $144.50.
Author

Ivan Brian
FXStreet
Ivan Brian started his career with AIB Bank in corporate finance and then worked for seven years at Baxter. He started as a macro analyst before becoming Head of Research and then CFO.


