|

Apple ( AAPL) incomplete sequences forecasting the path ahead

In this technical article we’re going to look at the Elliott Wave charts of  Apple Stock ( AAPL) published in members area of the website.  As probably most of the traders know, The Stock is in overall bullish trend.  Recently we forecasted the pull back which has corrected the cycle from the 195.88 low.  In further text we’re going to explain the Elliott Wave analysis.

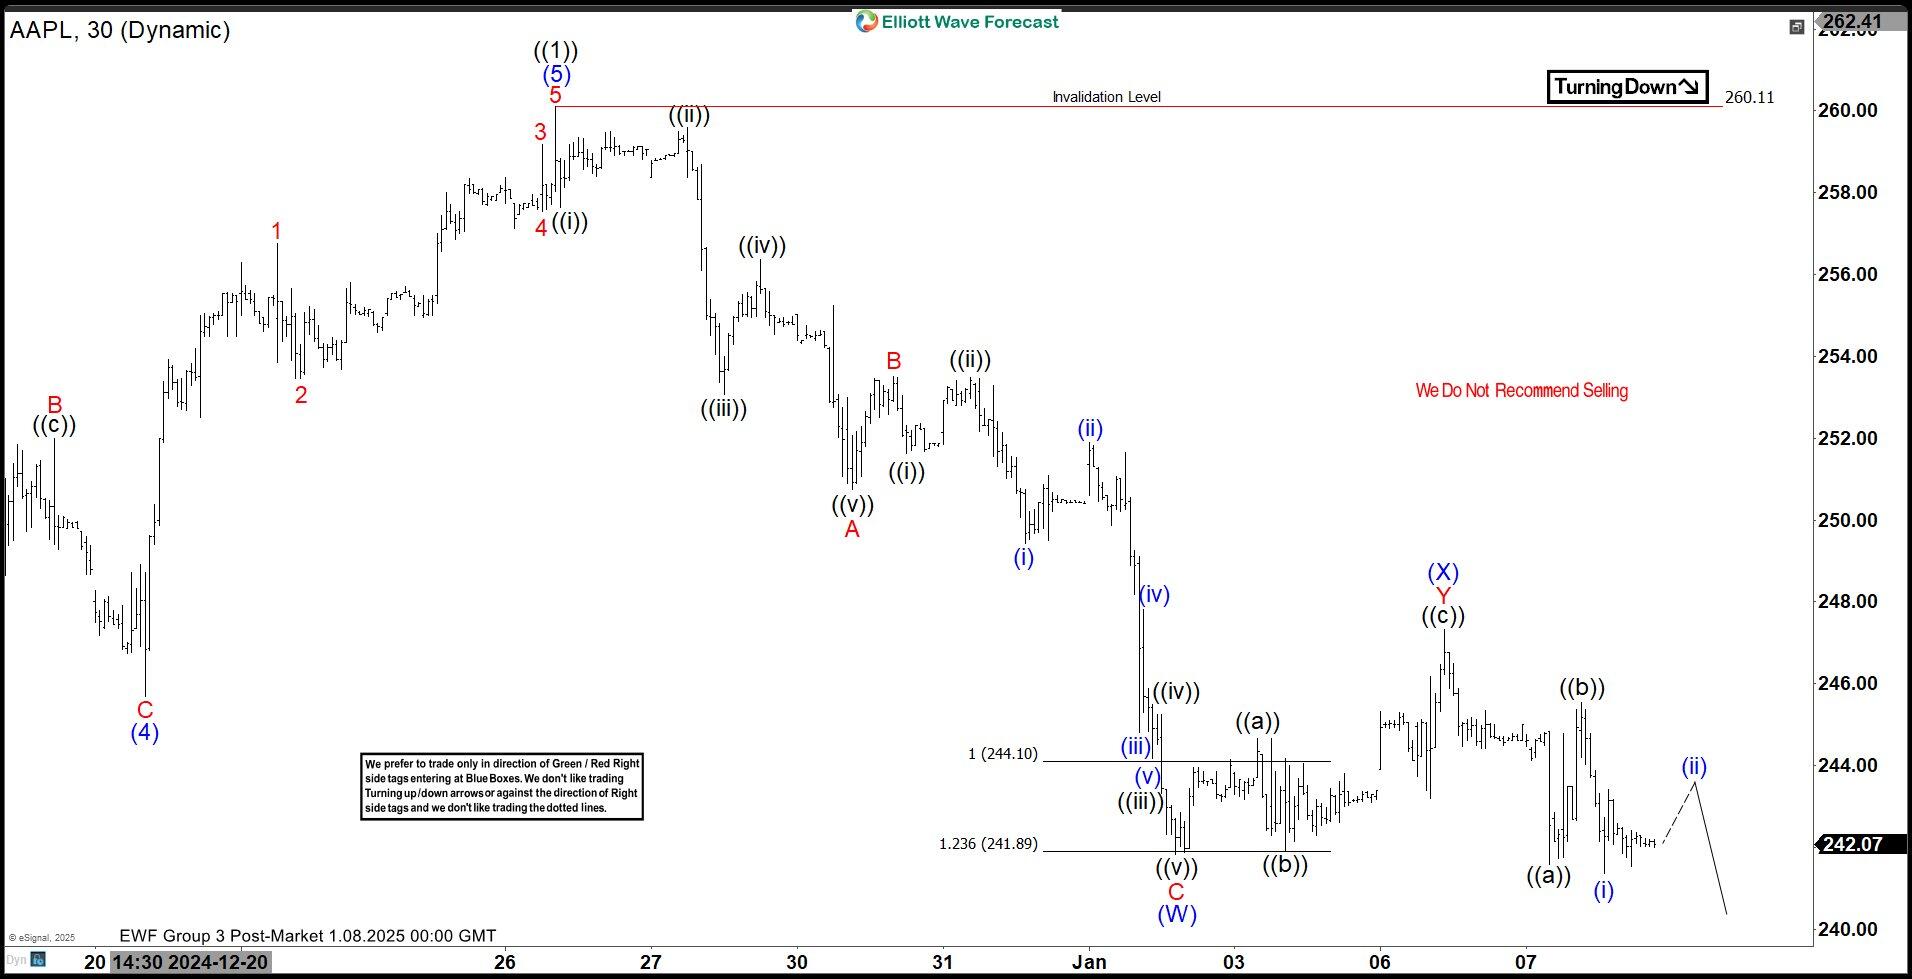
AAPL Elliott Wave one-hour chart 01.08.2025

Apple stock is showing incomplete sequences in the cycle from the 260.11 peak. A break of the (W) low created a lower low sequence, which calls for further weakness in the stock as long as the pivot at 247.35 (X) blue high holds. Apple could be heading toward the $229–$225 area.

Let’s analyze the price structure further.
We see a corrective structure from the peak, labeled as ABC red, followed by a three-wave bounce and another break lower. The current view suggests the correction may be unfolding as an Elliott Wave double-three pattern, labeled as (W)(X)(Y) blue, with wave ((x)) acting as a connector in the form of an Elliott Wave Zig Zag pattern.

We don’t recommend forcing trades at this stage. The strategy is to wait for the extreme zone to be reached before buying the stock again.

AAPL

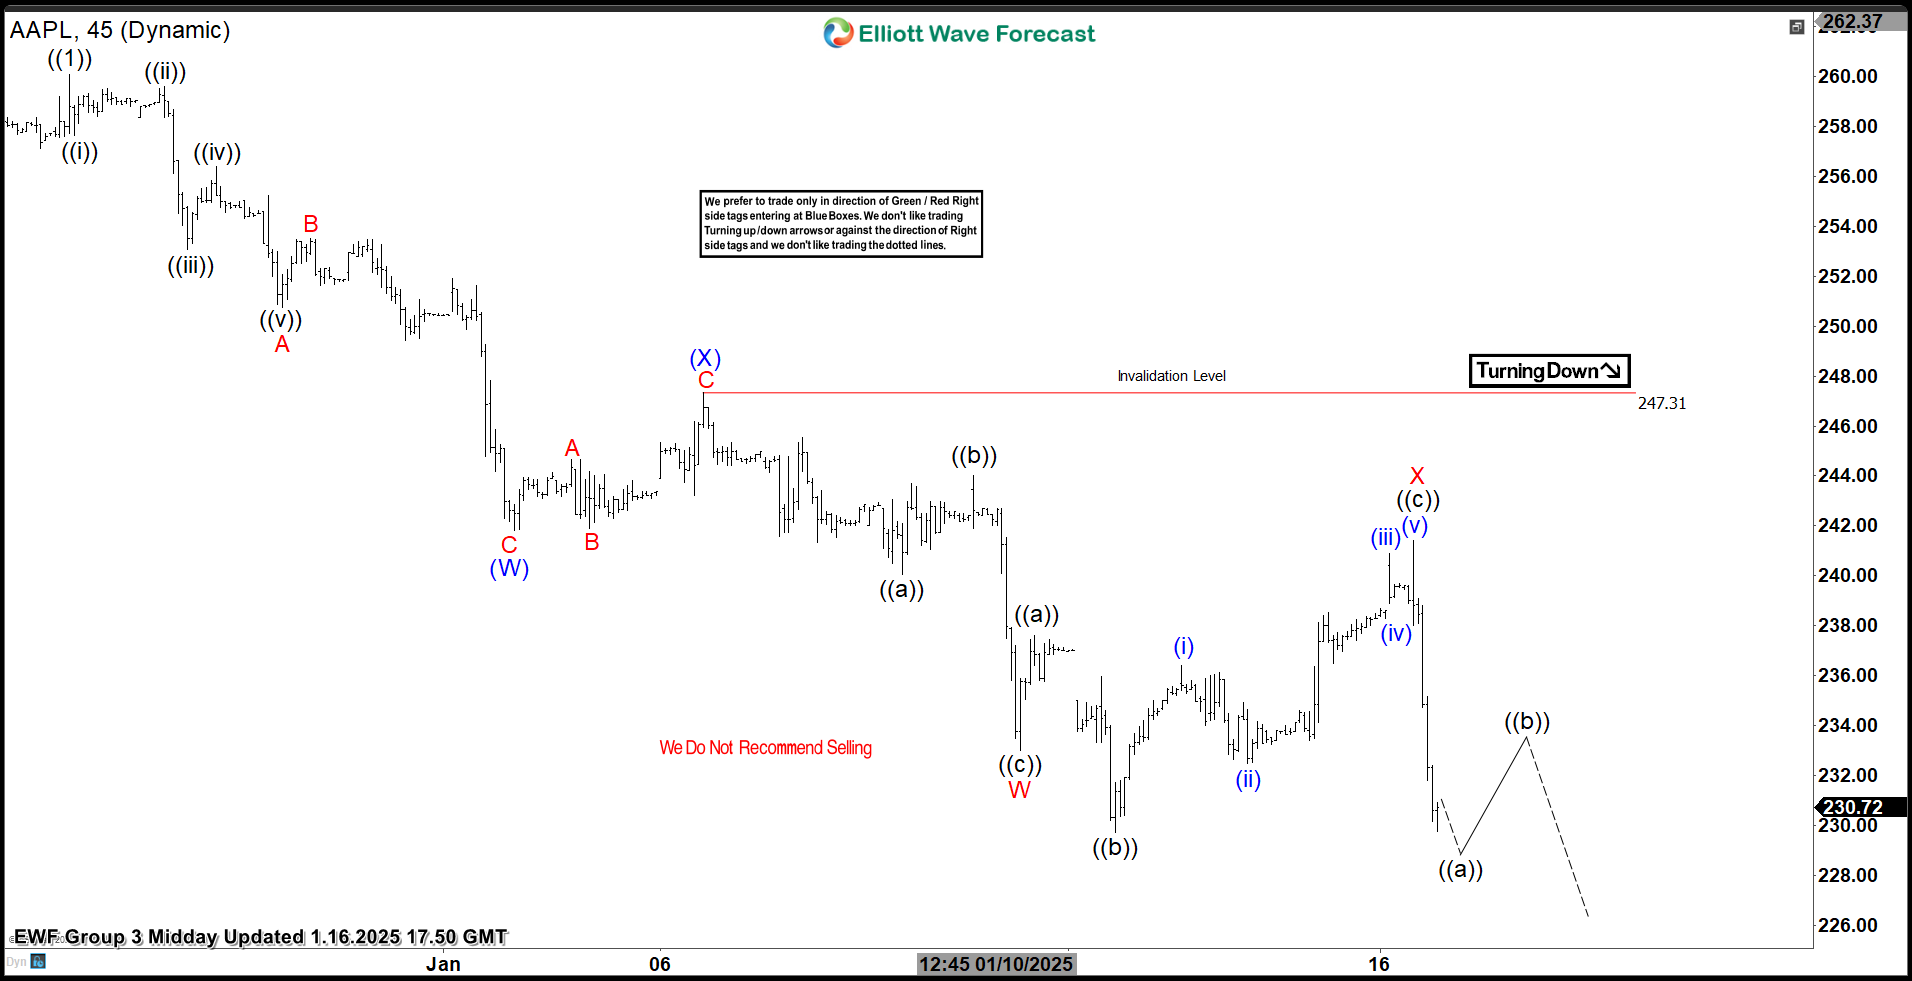
AAPL Elliott Wave one-hour chart 01.16.2025

The price remained below the 247.35 peak during short-term recoveries, and the stock made a further decline as expected. The price is heading toward our target area of $229–$225, where we would like to become buyers again. We don’t recommend selling the stock and prefer the long side from the mentioned extreme zone.

AAPL

Author

Elliott Wave Forecast Team

Elliott Wave Forecast Team

ElliottWave-Forecast.com

More from Elliott Wave Forecast Team
Share:

Markets move fast. We move first.

Orange Juice Newsletter brings you expert driven insights - not headlines. Every day on your inbox.

By subscribing you agree to our Terms and conditions.

Editor's Picks

EUR/USD rebounds after falling toward 1.1700

EUR/USD gains traction and trades above 1.1730 in the American session, looking to end the week virtually unchanged. The bullish opening in Wall Street makes it difficult for the US Dollar to preserve its recovery momentum and helps the pair rebound heading into the weekend.

GBP/USD steadies below 1.3400 as traders assess BoE policy outlook

Following Thursday's volatile session, GBP/USD moves sideways below 1.3400 on Friday. Investors reassess the Bank of England's policy oıtlook after the MPC decided to cut the interest rate by 25 bps by a slim margin. Meanwhile, the improving risk mood helps the pair hold its ground.

Gold stays below $4,350, looks to post small weekly gains

Gold struggles to gather recovery momentum and stays below $4,350 in the second half of the day on Friday, as the benchmark 10-year US Treasury bond yield edges higher. Nevertheless, the precious metal remains on track to end the week with modest gains as markets gear up for the holiday season.

Crypto Today: Bitcoin, Ethereum, XRP rebound amid bearish market conditions

Bitcoin (BTC) is edging higher, trading above $88,000 at the time of writing on Monday. Altcoins, including Ethereum (ETH) and Ripple (XRP), are following in BTC’s footsteps, experiencing relief rebounds following a volatile week.

How much can one month of soft inflation change the Fed’s mind?

One month of softer inflation data is rarely enough to shift Federal Reserve policy on its own, but in a market highly sensitive to every data point, even a single reading can reshape expectations. November’s inflation report offered a welcome sign of cooling price pressures. 

XRP rebounds amid ETF inflows and declining retail demand demand

XRP rebounds as bulls target a short-term breakout above $2.00 on Friday. XRP ETFs record the highest inflow since December 8, signaling growing institutional appetite.