|

Amazon (AMZN) reaching inflection area [Video]

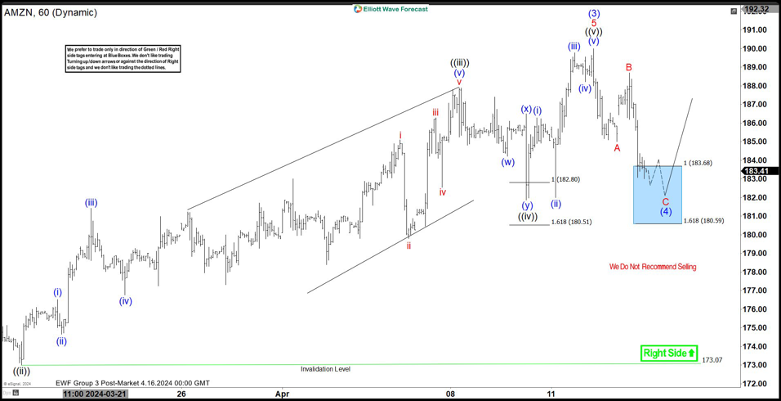
Short term Elliott Wave view in Amazon (AMZN) suggests the rally from 10.26.2023 low is unfolding as a 5 waves impulse. Up from 10.26.2023 low, wave (1) ended at 155.63 and pullback in wave (2) ended at 144.05. The stock extended higher in wave (3) which is proposed complete at 189.99 as the 1 hour chart below shows. Wave (4) pullback is currently in progress as a zigzag structure. Once wave (4) is complete, expect the stock to extend higher in wave (5).

Down from wave (3), wave A ended at 185 and rally in wave B ended at 188.69. Wave C lower is expected to complete at the blue box area of 180.59 – 183.68. This can also end wave (4) in higher degree. The stock should then either extend to new high in wave (5) or else at least rally in 3 waves.  Please note however that the 23.6 – 38.2% retracement of wave (3) is still lower at 172.2 – 179. Thus, if the pullback is really in wave (4), there’s a chance that the pullback may become a larger double correction or a larger zigzag structure in 3, 7, 11 swing before ending wave (4) and turning higher.

Amazon (AMZN) 60 minutes Elliott Wave chart

AMZN Elliott Wave [Video]

Author

Elliott Wave Forecast Team

Elliott Wave Forecast Team

ElliottWave-Forecast.com

More from Elliott Wave Forecast Team
Share:

Editor's Picks

EUR/USD treads water around 1.1900

EUR/USD edges a tad lower around the 1.1900 area, coming under mild pressure despite the US Dollar keeps the offered stance on turnaround Tuesday. On the US data front, December Retail Sales fell short of expectations, while the ADP four week average printed at 6.5K.

GBP/USD looks weak near 1.3670

GBP/USD trades on the back foot around the 1.3670 region on Tuesday. Cable’s modest retracement also comes in tandem with the decent decline in the Greenback. Moving forward, the US NFP and CPI data in combination with key UK releases should kee the quid under scrutiny in the next few days.

Gold flirts with daily lows near $5,000

Gold comes under marked selling pressure on Tuesday, giving back part of its recent two day advance and threatening to challenge the key $5,000 mark per troy ounce. The yellow metal’s correction follows a better tone in the risk complex, a lower Greenback and shrinking US Treasuty yields.

AI Crypto Update: BankrCoin, Pippin surge as sector market cap steadies above $12B

The Artificial Intelligence (AI) segment is largely on the back foot with major coins such as Bittensor (TAO) and Internet Computer (ICP) extending losses amid a sticky risk-off sentiment.

Dollar drops and stocks rally: The week of reckoning for US economic data

Following a sizeable move lower in US technology Stocks last week, we have witnessed a meaningful recovery unfold. The USD Index is in a concerning position; the monthly price continues to hold the south channel support.

XRP holds $1.40 amid ETF inflows and stable derivatives market

Ripple trades under pressure, with immediate support at $1.40 holding at the time of writing on Tuesday. A recovery attempt from last week’s sell-off to $1.12 stalled at $1.54 on Friday, leading to limited price action between the current support and the resistance.