Alibaba (BABA) Stock Price and Forecast: Why is Alibaba stock down again?
- Alibaba stock (BABA) falls again on Monday.
- Nasdaq: BABA continuing to suffer as investors shun Chinese names.
- Is a BABA bounce going to happen any time soon?

Another day, another 3% loss for Alibaba stock, which just cannot catch a break from investors as they continue to shun the name. The catalyst is well established now. The Chinese regulatory crackdown more or less originated with Alibaba and its proposed IPO of ANT Group, which was pulled at the last minute due to Chinese concerns over regulation and data privacy. The CEO of Alibaba had not helped the situation when he apparently criticized the Chinese hierarchy, and that was pretty much that. Exit stage left for CEO Jack Ma who has only made a few public appearances since, and in the meantime China has gone on a regulatory crackdown as it seeks to control its burgeoning tech space.
It moved on to Didi Global (DIDI), which did not sit well with investors just after the IPO, and the crackdown spread to many other Chinese tech stocks. China is concerned with the amount of data that its tech titans produce and how this data is stored and used. The overall result is a massive sell-off in Chinese tech names as can be seen from the chart below of the KraneShares China Internet Exchange Traded Fund (KWEB). It is down nearly 30% in the last three months and over 40% now year to date.
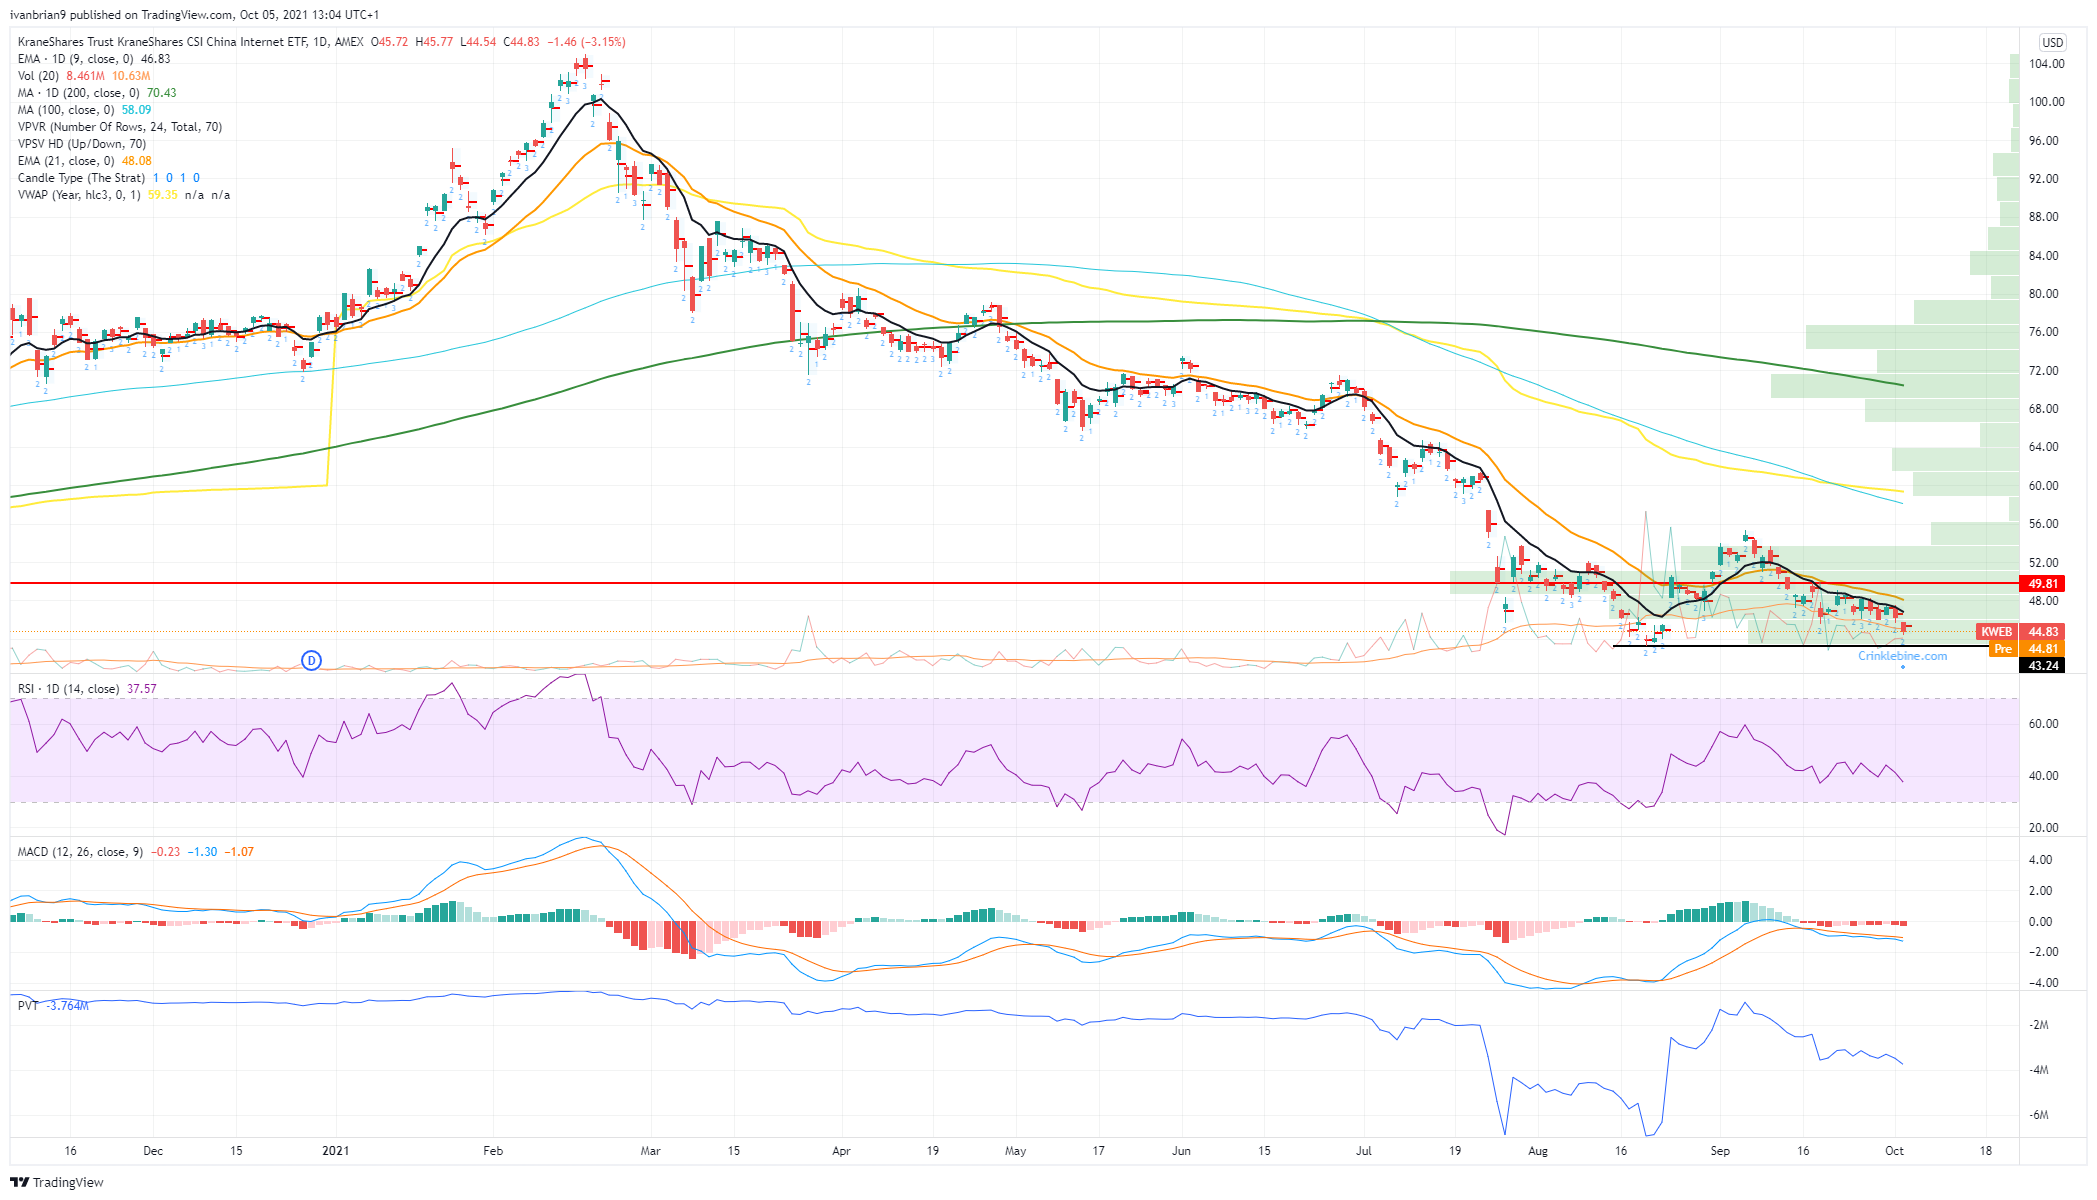
The top holdings in this one are familiar names, especially to retail traders who are very active in the likes of Tencent Holdings (TCEHY), Alibaba (BABA), JD.com (JD), Pinduoduo (PDD), Netease (NTES), Trip.com (TCOM), Baidu (BIDU) and Bilibili (BILI).
Alibaba (BABA) key statistics
| Market Cap | $396 billion |
| Price/Earnings | 17 |
| Price/Sales | 3.7 |
| Price/Book | 2.7 |
| Enterprise Value | $589 billion |
| Gross Margin | 38% |
| Net Margin |
19% |
| 52-week high | $319.32 |
| 52-week low | $138.43 |
| Average Wall Street Rating and Price Target | Buy, $248.31 |
Alibaba (BABA) stock news
The news is providing some headwinds for Alibaba stock recently, but at least some good news this morning with Standard & Poor's saying Alibaba's A+ rating is affirmed with a stable outlook. However, it is sentiment toward the stock that is the problem. This has not been helped by recent downgrades. Mizuho cut their price target to $245 on Monday, and Raymond James cut their rating to outperform and lowered the price target from $300 to $240. Bernstein has also recently cut its price target for BABA stock.
A recent announcement from China's cyberspace administration that it will set governance rules for algorithms in three years has also turned heads. The administration added that algorithms used by technology firms should uphold core values of socialism and must be "fair and transparent". The increasing crackdown has led many investors to shun Chinese internet names with no sign of a bounce in sight just yet. As we have mentioned many times before, markets hate uncertainty more than bad news.
Alibaba (BABA) stock forecast
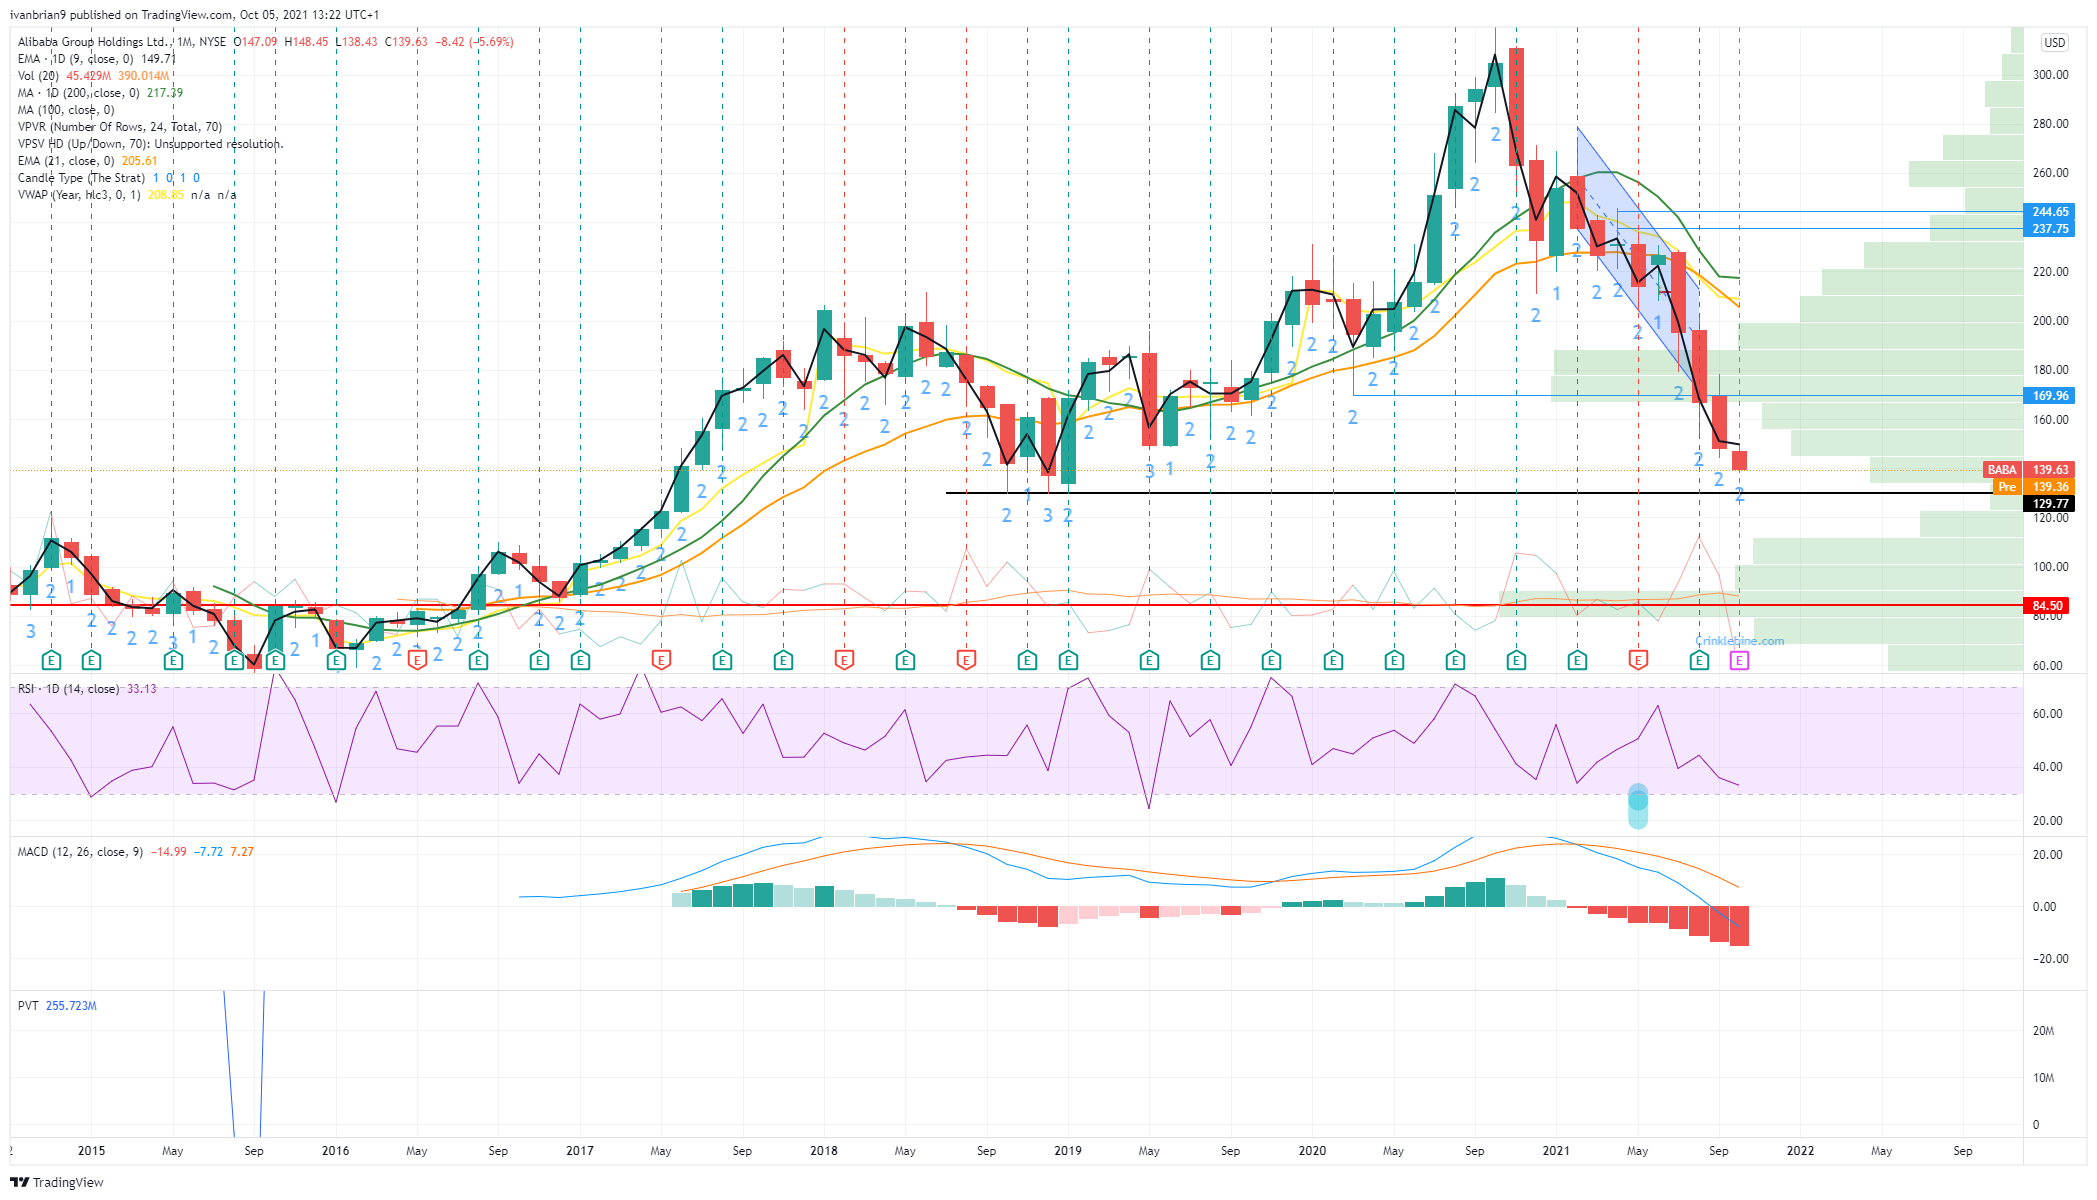
We really need to take a step back and look at the monthly chart for this one given where the stock has fallen to. There is potentially some hope at $129.77 with support there from the lowes back in July 2018. Alibaba (BABA) stock made several attempts to break the level before going on a huge rally. Given the volume profile bars on the right of the chart, we would prefer if Alibaba (BABA) did not even get to test that support, as once below $134 volume drops off sharply and a volume vacuum can often lead to a price vacuum. That would leave $100 as the obvious psychological support. Volume does indeed pick up there.
FXStreet View: Clearly bearish! Neutral above $170.
FXStreet Ideas: Support at $134 and $129.77 if you want to catch a falling knife and buy the dip, but please use a stop. Otherwise, volume picks up again at $100 and then $85.
Author

Ivan Brian
FXStreet
Ivan Brian started his career with AIB Bank in corporate finance and then worked for seven years at Baxter. He started as a macro analyst before becoming Head of Research and then CFO.


