Advanced Micro Devices Inc. (AMD) stocks Elliott Wave technical analysis [Video]
![Advanced Micro Devices Inc. (AMD) stocks Elliott Wave technical analysis [Video]](https://editorial.fxsstatic.com/images/i/Equity-Index_S&P500-1_XtraLarge.jpg)
AMD Elliott Wave Analysis Trading Lounge.
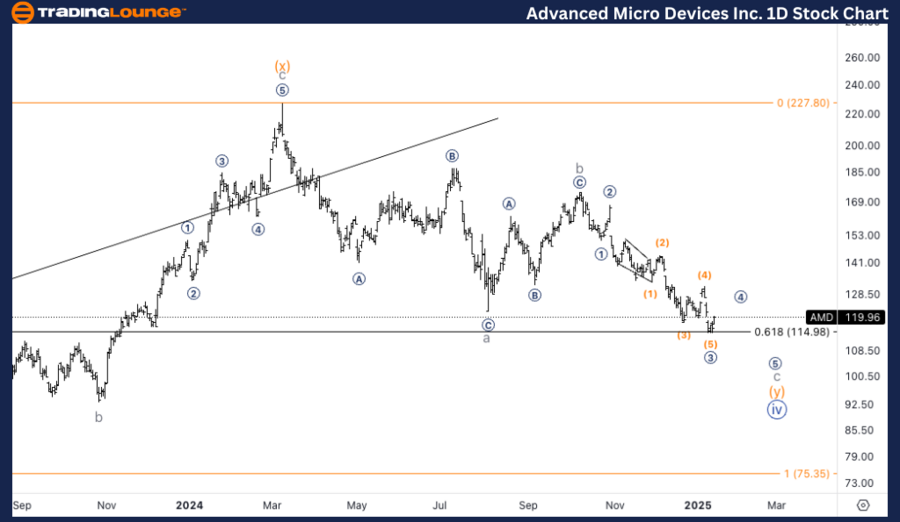
Advanced Micro Devices Inc., (AMD) Daily Chart.
AMD Elliott Wave technical analysis
Function: Counter Trend.
Mode: Corrective.
Structure: Flat.
Position: Wave (y) of {iv}.
Direction: Bottom in wave {iv}.
Details: We are looking for continuation lower. We have touched 0.618 (y) vs (w) and equality stands at 75$. In addition we are also at 0.618 wave c vs. a of (y).
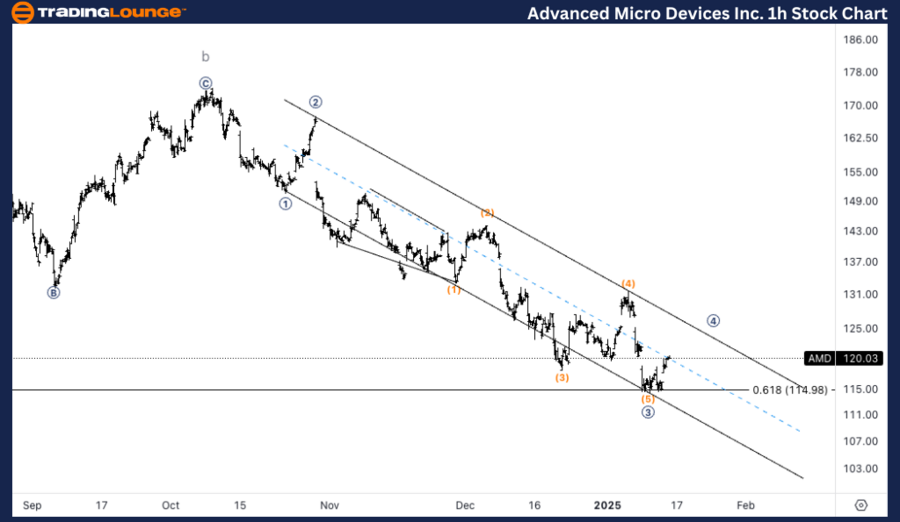
Advanced Micro Devices Inc., (AMD) 1H Chart.
AMD Elliott Wave technical analysis
Funciton: Counter Trend.
Mode: Corrective.
Structure: Flat.
Position: Micro wave 3 of c.
Direction: Bottom in wave c.
Details: We are looking for another pullback in micro wave 4 of sub minuette c to then continue lower into wave c. As we stand at 120$ we need to start trading below it to confirm further downside.
This Elliott Wave analysis of Advanced Micro Devices Inc., (AMD) outlines both the daily and 1-hour chart structures, highlighting the current trends and possible future price movements.
AMD Elliott Wave technical analysis – Daily chart
Advanced Micro Devices (AMD) is in a corrective phase, with wave {iv} continuing lower. The price has already touched the 0.618 Fibonacci level for (y) vs. (w), and the equality target stands at $75. In addition, we have also reached the 0.618 ratio of wave c vs. a within wave (y), signaling the potential for a bottom soon. Further downside is still expected before confirmation of the completion of wave {iv}.
AMD Elliott Wave technical analysis – One-hour chart
On the 1H chart, AMD is currently experiencing a pullback in micro wave 4 of subminuette wave c. We anticipate another leg lower to complete wave c. With the current price at $120, trading below this level is essential to confirm further downside as part of the ongoing corrective wave.
Technical analyst: Alessio Barretta.
AMD Elliott Wave technical analysis [Video]
Author

Peter Mathers
TradingLounge
Peter Mathers started actively trading in 1982. He began his career at Hoei and Shoin, a Japanese futures trading company.


