Today’s article deals with allocating funds in your 401(k) or other defined-benefit pension plan and how determine fund performance so you can invest wisely.
Many people work for companies or other entities that sponsor defined-contribution pension plans. These plans are usually referred to in the United States by the section of the Internal Revenue Code that regulates them. Examples are the 403(b) plans for teachers and non-profit employees; 457(b) plans for other public employees; and, most numerous, 401(k) plans for corporate employees.
In each of these arrangements, an employer sets up a plan to which the employee can contribute a portion of his or her salary. The employer may or may not also contribute “matching” amounts, up to a limit of say 4% or 6% of compensation. The amounts that the employee contributes reduce the employee’s current-year taxable income (although Social Security tax must still be paid on the contributions). Amounts contributed by the employer are also not taxed to the employee in the year of the contribution.
The funds contributed to the pension plan are invested. Each employee’s portion of the fund is tracked. Upon retirement, the employee may begin withdrawing money from the pension fund. The withdrawals are taxed at the former employee’s then-current tax rate. If the tax rate is the same as it was in the years when the funds were contributed, then the tax is the same as it would have been if collected in the earlier years; it has only been deferred until retirement. This deferral is valuable in itself, as money that you can spend today is worth more than the same amount of money received later.
For some people, total income after retirement is less than it was when they were working. For them, the postponement of the taxing of the retirement funds is not just a deferral, but an actual reduction of tax paid. This is even more valuable (assuming that tax rates haven’t changed in the interim to negate this benefit).
Besides the tax benefits, it is only prudent to “max out” your contributions to your pension plan, at least to the extent that your employer matches them with contributions of its own. This employer match is a 100% return on investment in the year that you make your side of the contribution. Failing to take maximum advantage of that is just throwing money away.
Once you have money in your pension plan, it must then be invested. What you can withdraw in retirement depends on how much has been contributed and how those contributions have grown over the years, which is where evaluating mutual fund performance comes in. With all of these types of plans, whether you can eventually live on the proceeds is of no interest or concern to your employer or the plan administrator. The reason these plans replaced the older type of “defined-benefit” pension plans (which paid employees a percentage of their final salary for the rest of their lives), was precisely so that the risk of your outliving your funds was transferred from your employer to you.
This means that you must decide whether and how much to contribute to your plan if one is available to you. That one has an easy answer: Yes, and as much as you’re allowed to.
You also must make some harder decisions; how you will direct your portion of the funds to be invested on your behalf. These choices are just as crucial. Your future livelihood literally depends on your making the right ones. And yet most people feel (justifiably) ill-equipped to evaluate fund performance and make these decisions.
There are several aspects to this question, but we’ll limit ourselves to just one today. Which investments should I choose?
For most people, the choices are limited. This can be good or bad depending on whether that limited number of alternatives available to you includes some good ones. Most employers outsource the management of pension plans to an outside company. Most of these pension management firms have arrangements with one or more mutual fund sponsors (companies like Fidelity, Vanguard, etc.) The plan sponsors select a number of mutual funds from that sponsor and offer them to you. Your choices usually include funds in these categories:
Stock-based funds (with subcategories for large-cap, small and midcap, “value” and “growth” subtypes)
Bond-based Funds (Long-term treasury, Investment Grade or High-yield bonds. High-yield bonds are also called junk bonds, and are more risky.)
Blended funds, with both stocks and bonds. These include so-called “target-date” funds.
Sometimes, gold funds
You will want to pick one fund from each of two or three categories offered to you to make sure that your retirement fund is diversified. All asset categories have their good and bad years. Diversification makes it less likely that a terrible year in one asset class (remember 2008?) turns into a terrible year for your portfolio.
The prospectuses and other information for each fund naturally make it sound attractive. But in deciding which one to pick in that category, a picture can be worth much more than a thousand words.
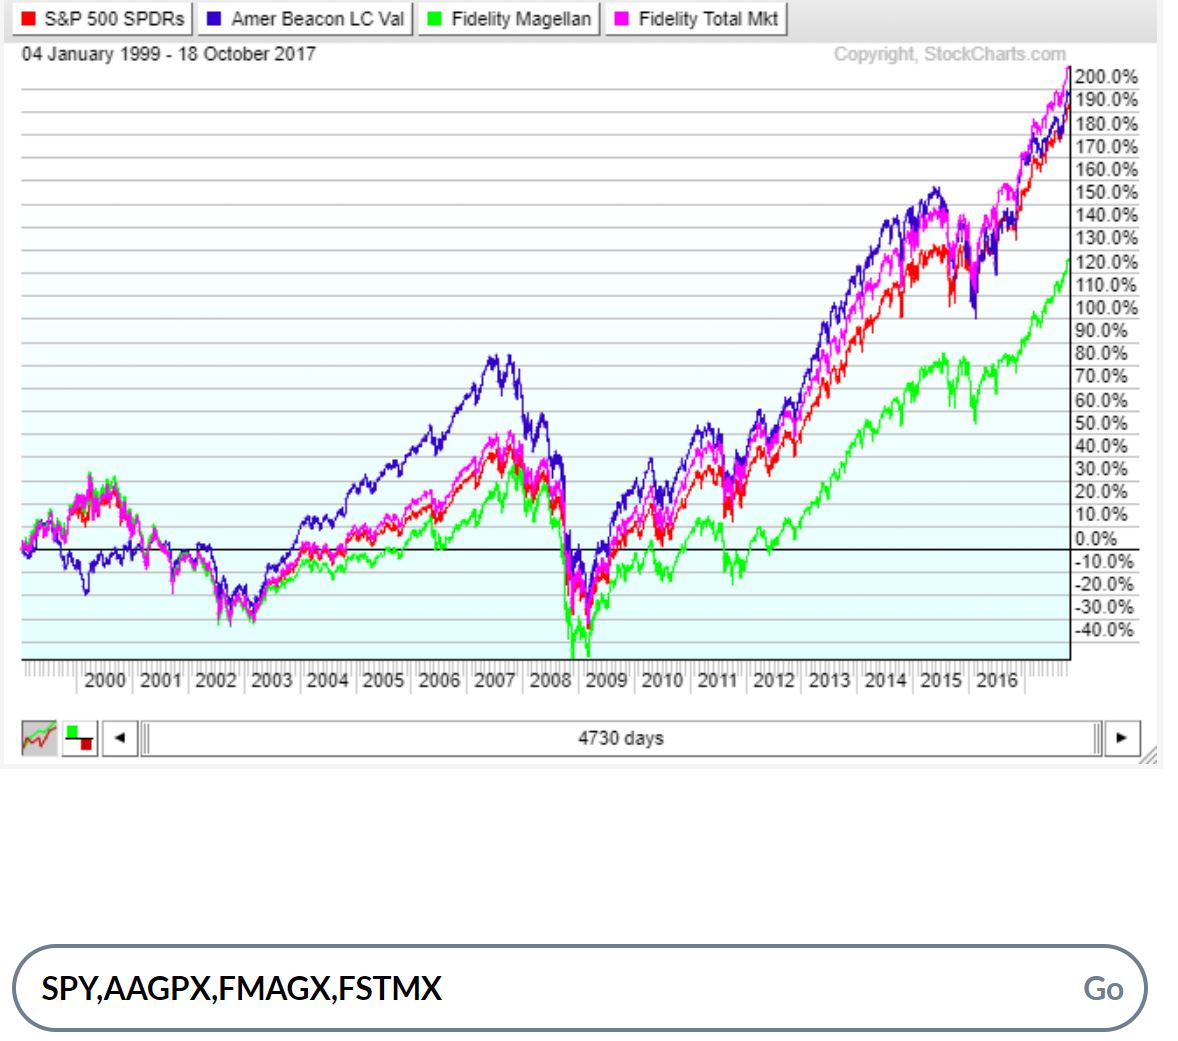
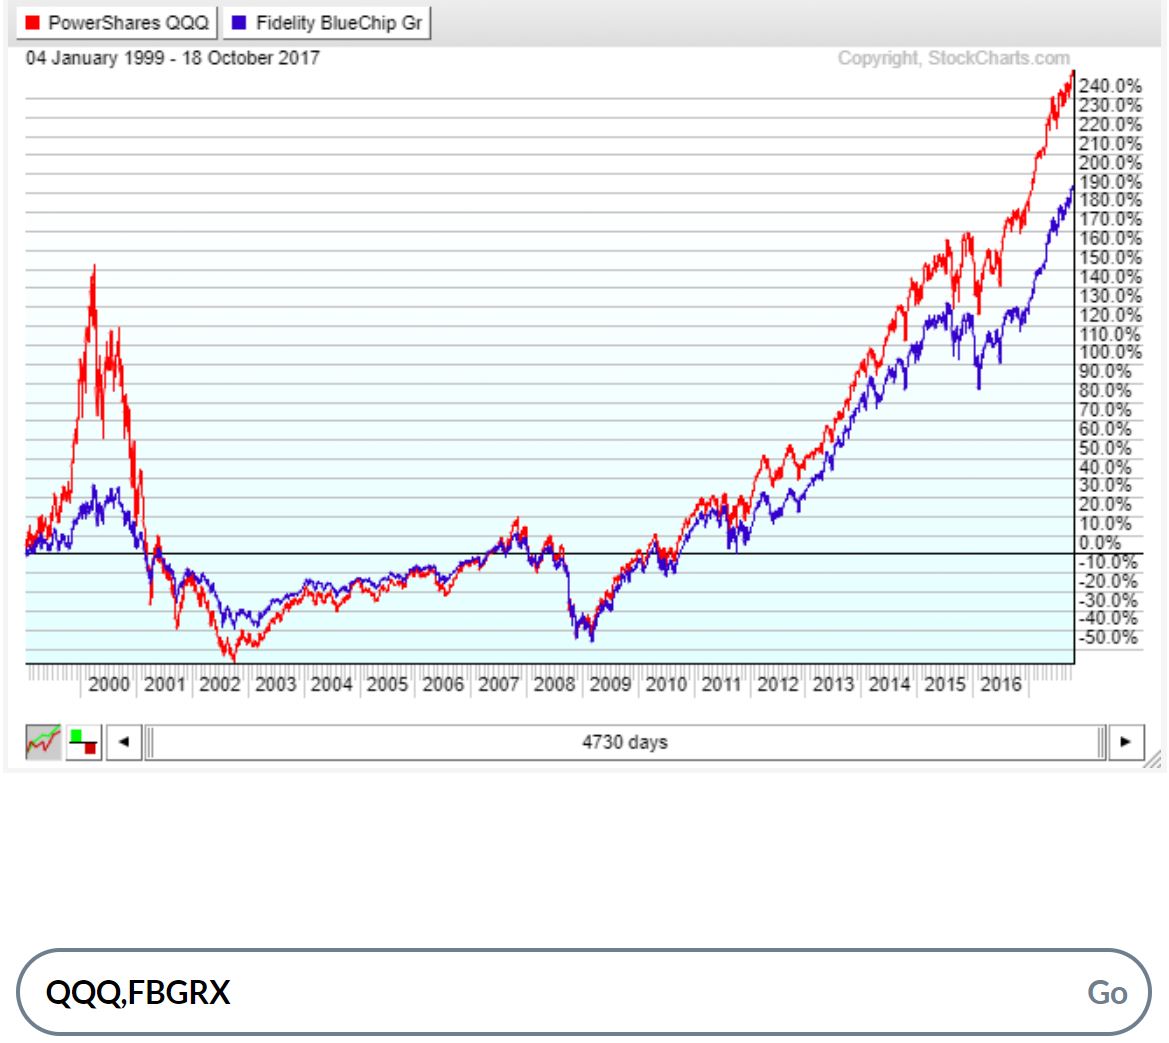
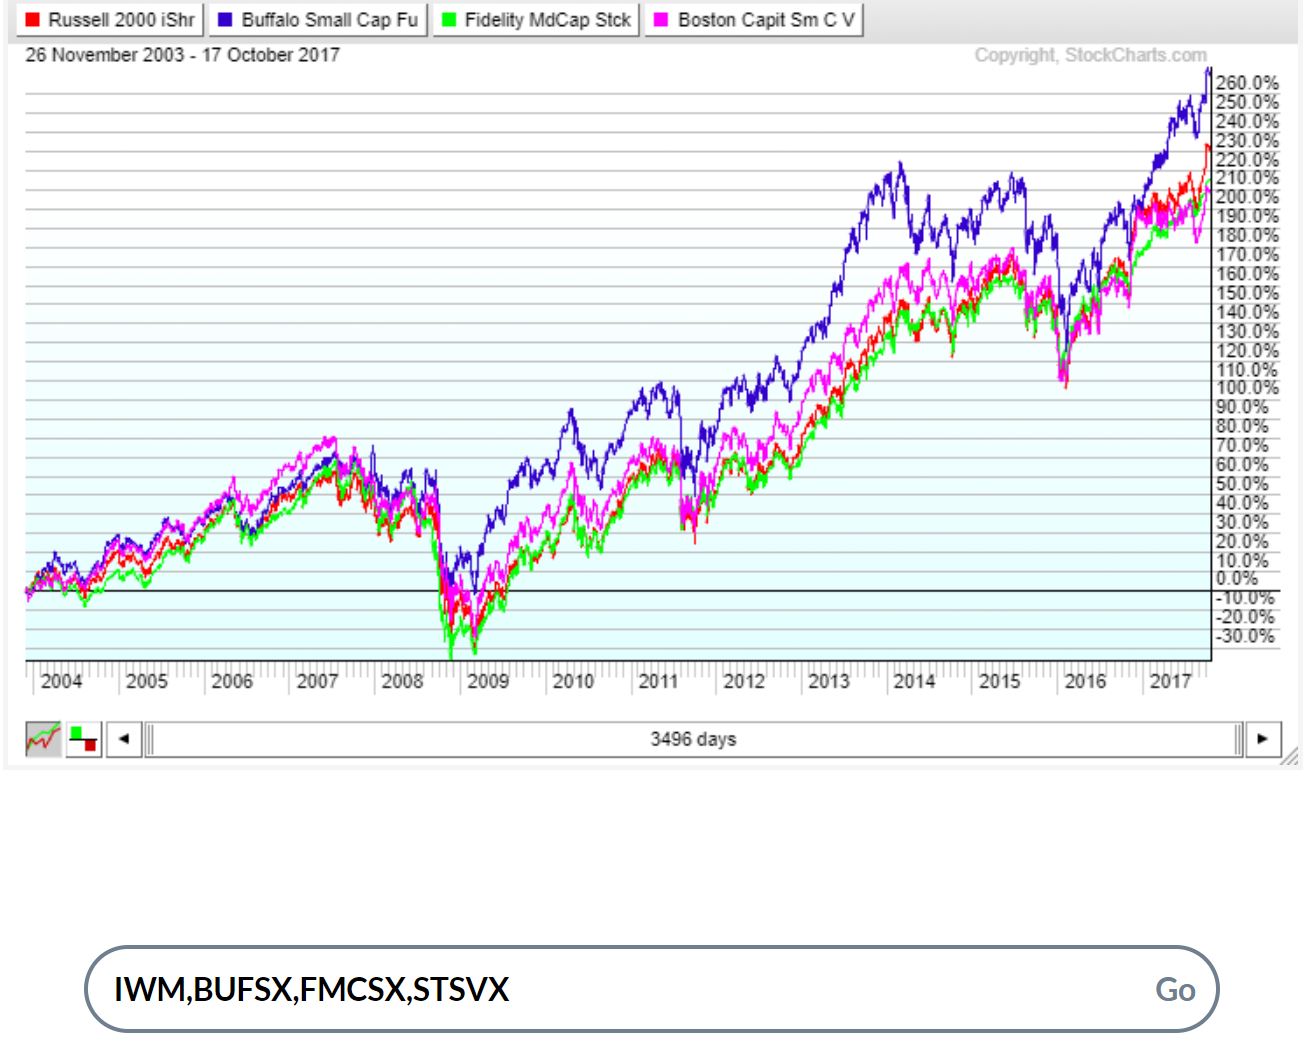
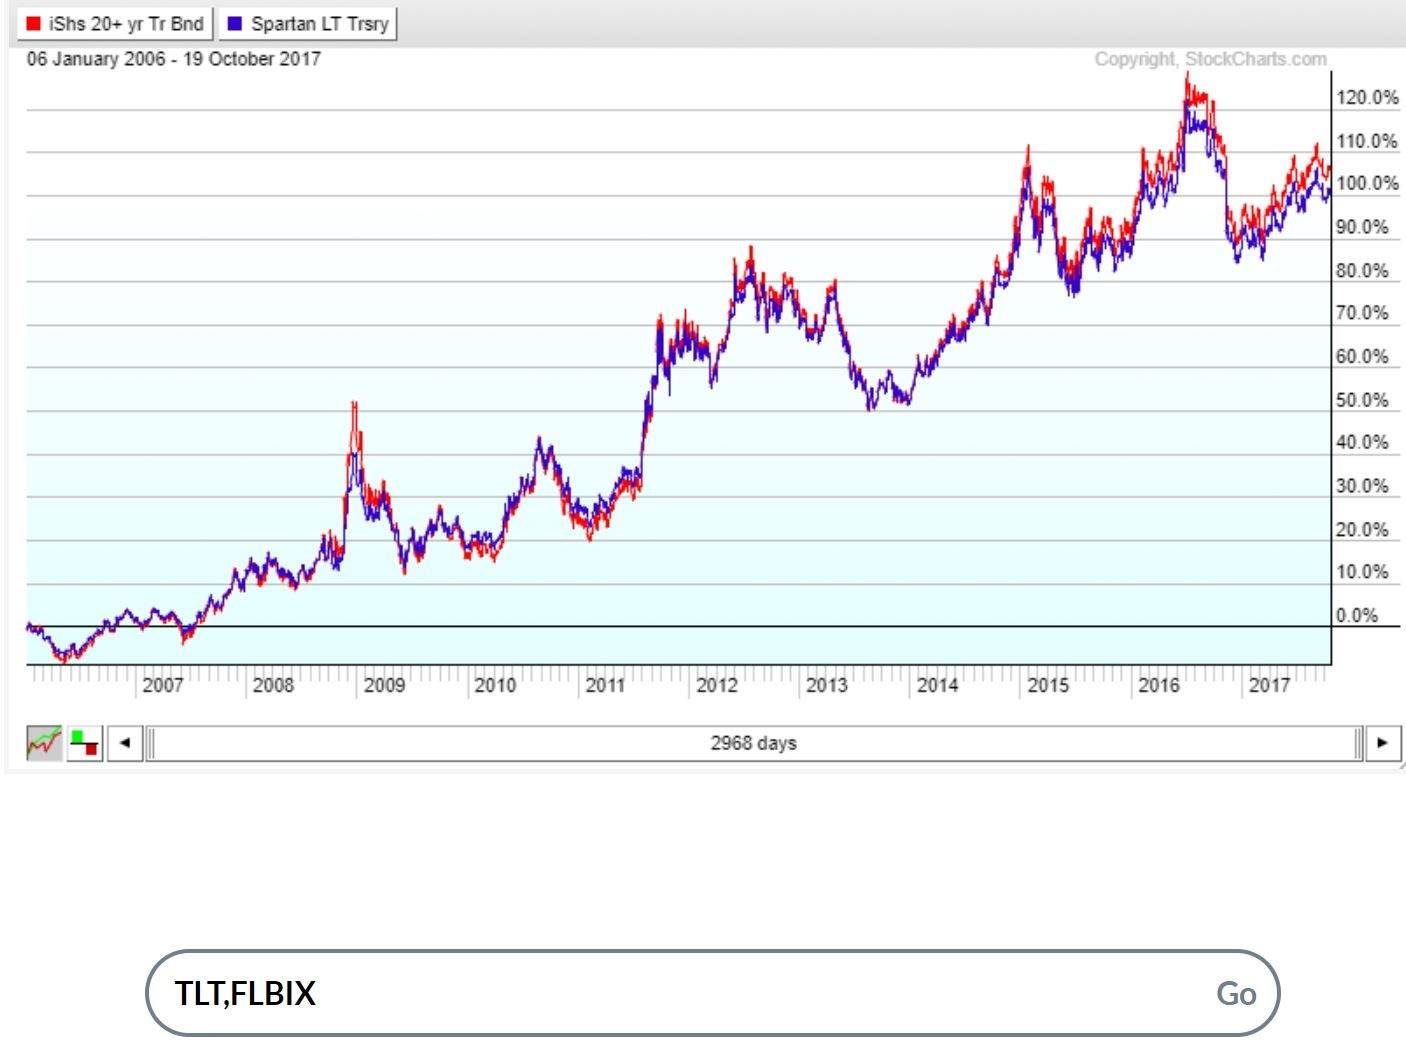
Below are some comparison graphs that include some commonly-available mutual funds. They are probably not the ones that happen to be on your list. The idea is to show you how to compare your funds to a benchmark, or standard of comparison so you can determine if that mutual fund’s performance is above or below average. The graphs are not meant to be any kind of a recommendation. You will need to identify from your funds’ names or other information about them which category they fall into.
When considering the funds from which you have to choose, you should compare all of the ones of a particular type, or category, to a benchmark that is relevant for that type. In most cases there is an exchange-traded fund that represents that type.
There are a few free stock charting services on the web. One of the better ones for comparing performance is stockcharts.com. You can access a charting tool that lets you easily compare stocks, ETFs or mutual funds.
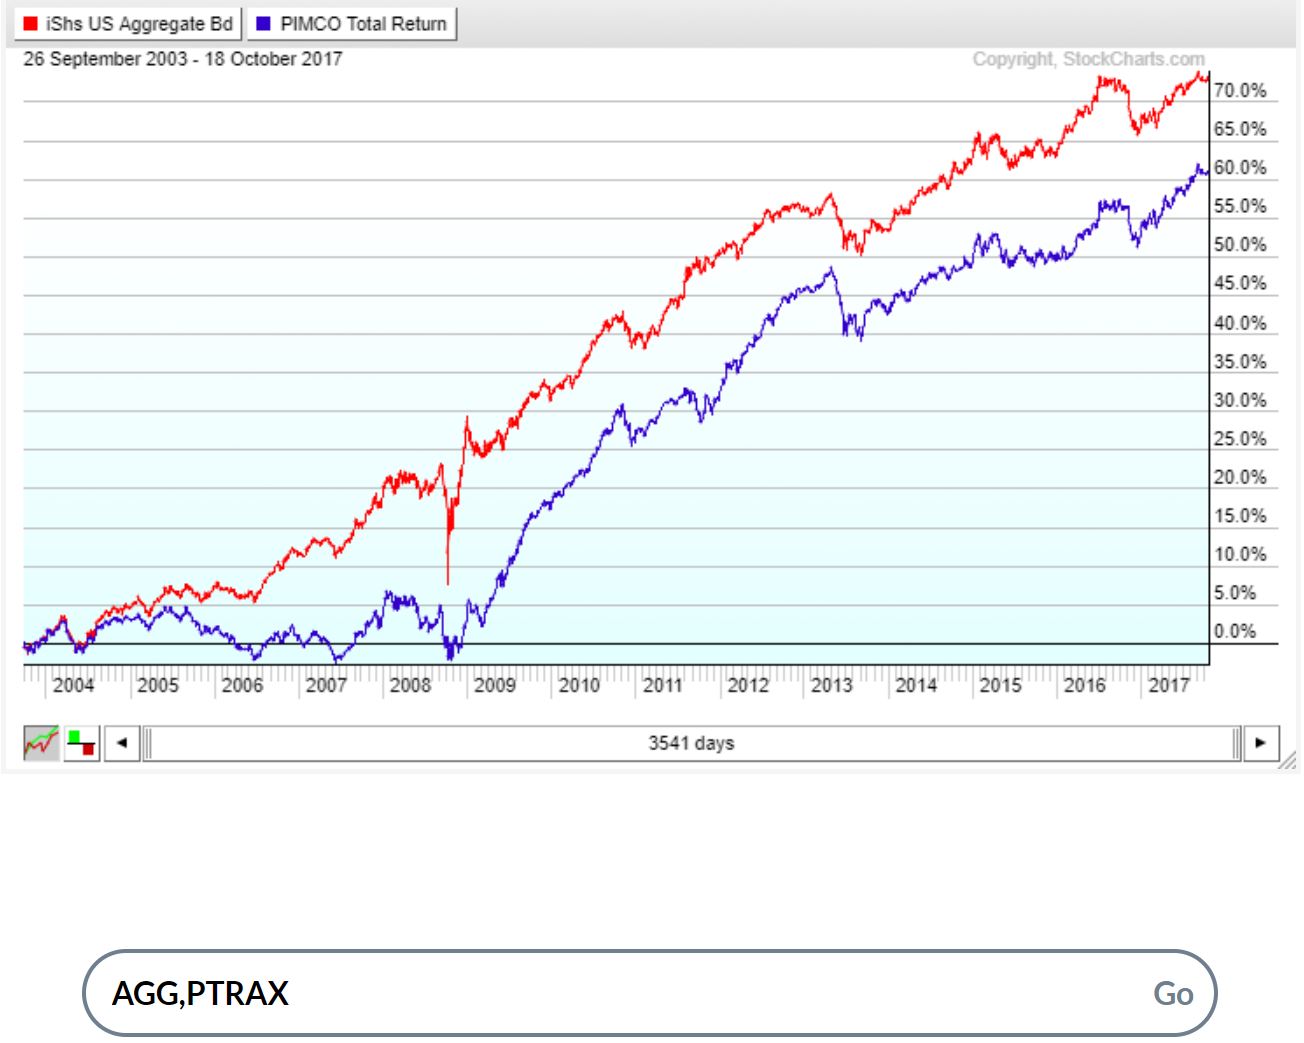
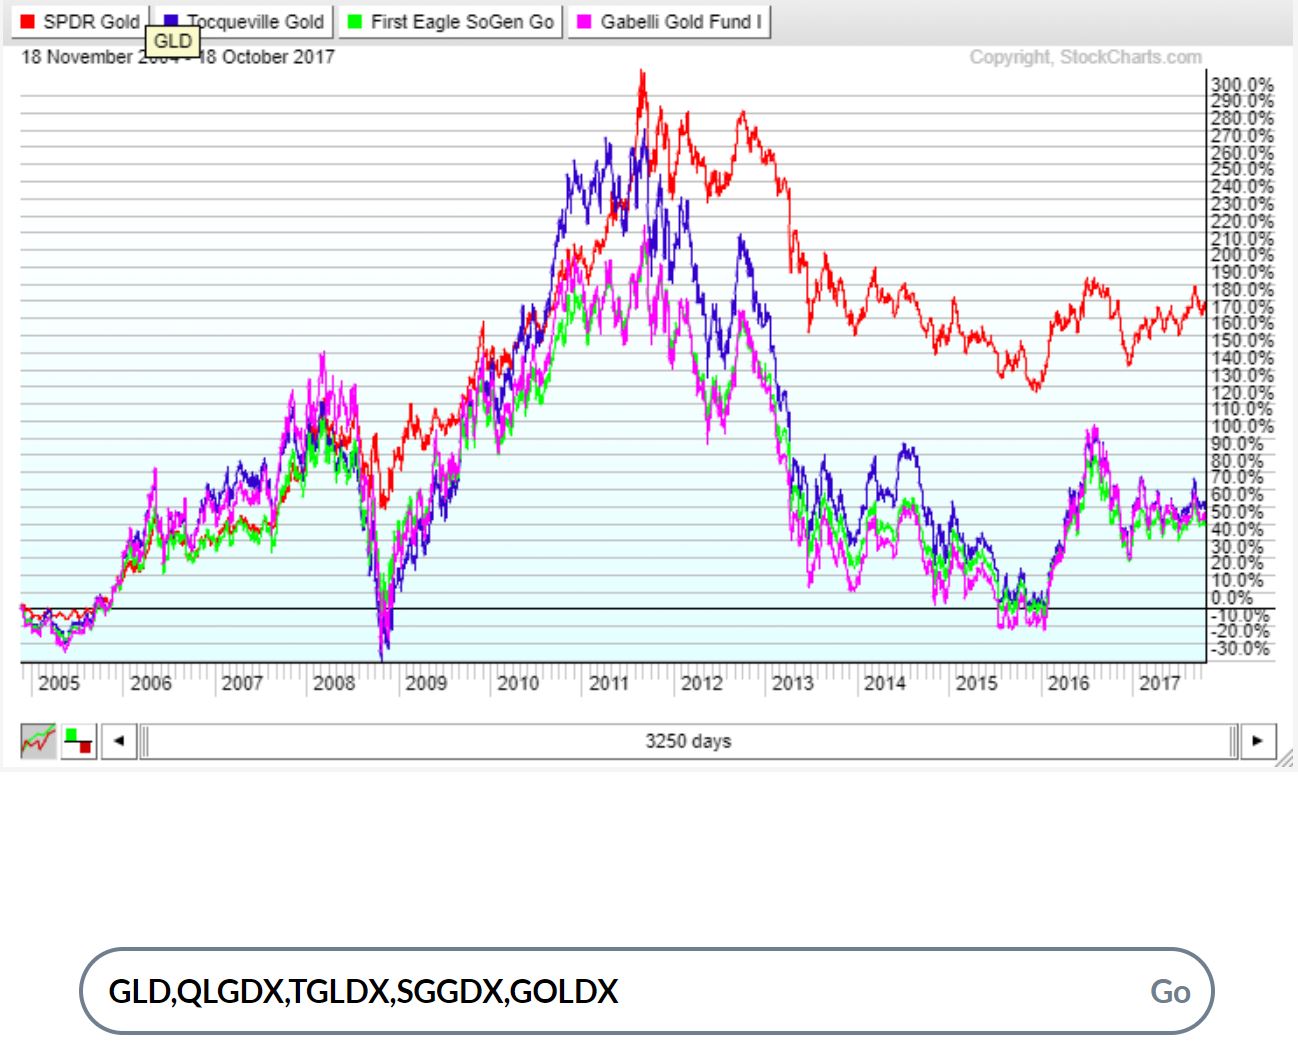
Below are illustrative sets of charts for six different categories of mutual funds, with their relevant benchmarks. The charts show the funds’ performance, in terms of rate of return over time. Your job is to categorize each of the funds on your list into one of these categories; and then compare all of the funds in a category to its relevant benchmark. When you do, it will probably become clear to you which is your best choice; and if it’s not clear which is best, then it probably doesn’t matter much which one you pick in that category.
In making your comparison, it is certainly important to look for better overall fund performance in terms of the “hard right edge” of the chart (a higher number at the end). But equally important is how that fund performed in the bad times. When there was a downturn, all of the funds in the category will have been affected negatively but to different degrees. The ability to withstand the worst times is worth a few percentage points in the good times. Look at the percentage drops in the bad times and think about how you would have felt about it. A plan that you can’t follow is not really a plan.
The graphs presented below are in six categories. Here are the categories with the relevant benchmark for each one:
-
Equities (Stocks) – Index or Large-Cap Value – benchmark SPY
-
Equities – Large-Cap Growth – benchmark QQQ
-
Equities – Mid-Cap or Small-Cap benchmark IWM
-
Long-term US Treasury Bonds – benchmark TLT
-
Investment-grade Bonds, Non-treasury – benchmark AGG
-
Gold funds – benchmark GLD
Here are the charts, created using the tool from stockcharts.com whose link was provided above. As you can see below each chart, there is a place for you to enter the symbols for all of your available mutual funds for that category, separated by commas, as we have done for these illustrative sets.
In each set below, the red line represents the benchmark exchange-traded fund against which your funds of that category should be measured.
Diversifying your portfolio across asset classes; and then picking the best from among your available choices in each class is the first step in making sure that your retirement funds last as long as you do. There’s lots more to learn. Look into our Proactive Investor course at your local center.
This content is intended to provide educational information only. This information should not be construed as individual or customized legal, tax, financial or investment services. As each individual's situation is unique, a qualified professional should be consulted before making legal, tax, financial and investment decisions. The educational information provided in this article does not comprise any course or a part of any course that may be used as an educational credit for any certification purpose and will not prepare any User to be accredited for any licenses in any industry and will not prepare any User to get a job. Reproduced by permission from OTAcademy.com click here for Terms of Use: https://www.otacademy.com/about/terms
Editors’ Picks

EUR/USD off highs, back to 1.1850
EUR/USD loses some upside momentum, returning to the 1.1850 region amid humble losses. The pair’s slight decline comes against the backdrop of a marginal advance in the US Dollar as investors continue to assess the latest US CPI readings.

GBP/USD advances to daily tops around 1.3650
GBP/USD now manages to pick up extra pace, clinching daily highs around 1.3650 and leaving behind three consecutive daily pullbacks on Friday. Cable’s improved sentiment comes on the back of the inconclusive price action of the Greenback, while recent hawkish comments from the BoE’s Pill also collaborates with the uptick.

Gold surpasses $5,000/oz, daily highs
Gold is reclaiming part of the ground lost on Wednesday’s marked decline, as bargain-hunters keep piling up and lifting prices past the key $5,000 per troy ounce. The yellow metal’s upside is also propped up by the lack of clear direction around the US Dollar post-US CPI release.

Crypto Today: Bitcoin, Ethereum, XRP in choppy price action, weighed down by falling institutional interest
Bitcoin's upside remains largely constrained amid weak technicals and declining institutional interest. Ethereum trades sideways above $1,900 support with the upside capped below $2,000 amid ETF outflows.

Week ahead – Data blitz, Fed Minutes and RBNZ decision in the spotlight
US GDP and PCE inflation are main highlights, plus the Fed minutes. UK and Japan have busy calendars too with focus on CPI. Flash PMIs for February will also be doing the rounds. RBNZ meets, is unlikely to follow RBA’s hawkish path.
RECOMMENDED LESSONS
Making money in forex is easy if you know how the bankers trade!
I’m often mystified in my educational forex articles why so many traders struggle to make consistent money out of forex trading. The answer has more to do with what they don’t know than what they do know. After working in investment banks for 20 years many of which were as a Chief trader its second knowledge how to extract cash out of the market.
5 Forex News Events You Need To Know
In the fast moving world of currency markets where huge moves can seemingly come from nowhere, it is extremely important for new traders to learn about the various economic indicators and forex news events and releases that shape the markets. Indeed, quickly getting a handle on which data to look out for, what it means, and how to trade it can see new traders quickly become far more profitable and sets up the road to long term success.
Top 10 Chart Patterns Every Trader Should Know
Chart patterns are one of the most effective trading tools for a trader. They are pure price-action, and form on the basis of underlying buying and selling pressure. Chart patterns have a proven track-record, and traders use them to identify continuation or reversal signals, to open positions and identify price targets.
7 Ways to Avoid Forex Scams
The forex industry is recently seeing more and more scams. Here are 7 ways to avoid losing your money in such scams: Forex scams are becoming frequent. Michael Greenberg reports on luxurious expenses, including a submarine bought from the money taken from forex traders. Here’s another report of a forex fraud. So, how can we avoid falling in such forex scams?
What Are the 10 Fatal Mistakes Traders Make
Trading is exciting. Trading is hard. Trading is extremely hard. Some say that it takes more than 10,000 hours to master. Others believe that trading is the way to quick riches. They might be both wrong. What is important to know that no matter how experienced you are, mistakes will be part of the trading process.
The challenge: Timing the market and trader psychology
Successful trading often comes down to timing – entering and exiting trades at the right moments. Yet timing the market is notoriously difficult, largely because human psychology can derail even the best plans. Two powerful emotions in particular – fear and greed – tend to drive trading decisions off course.
