When to adjust your stop loss

I have already written a lengthy report with plenty of examples on how to manage your risk when in a trade in THIS article. But I wanted to provide a template here to give you an idea of exactly when I normally adjust the stop loss.
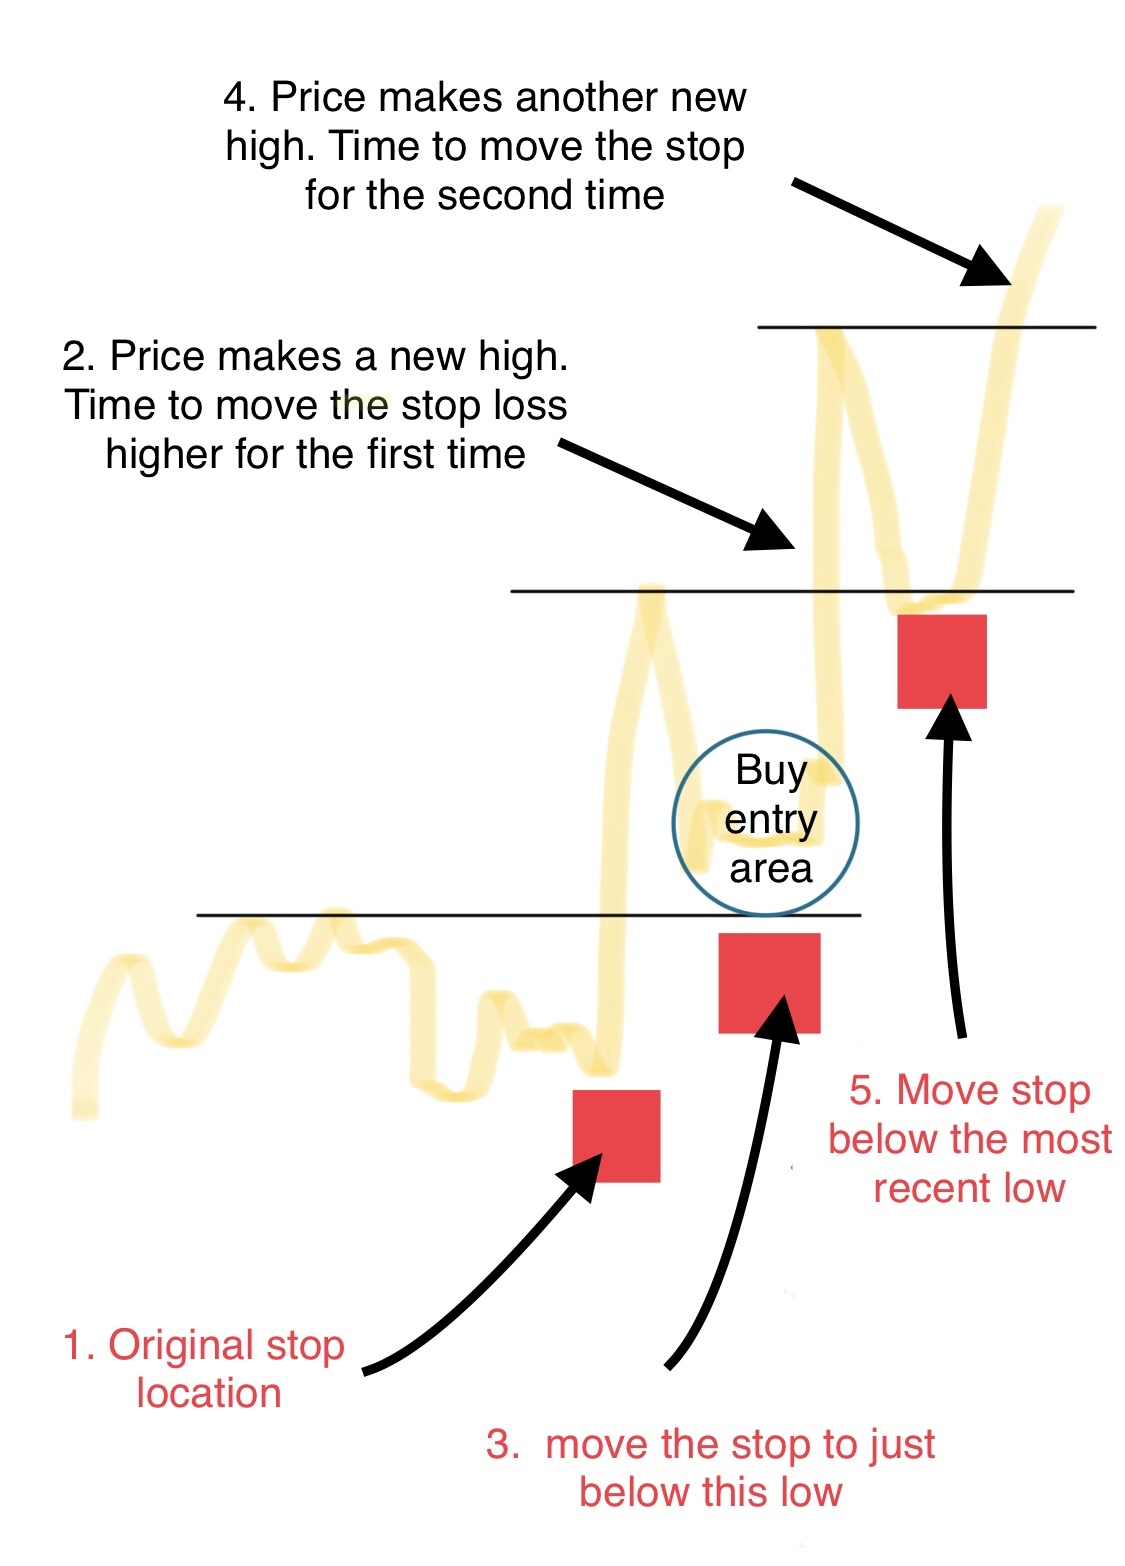
Let's get straight to the point. The diagram below describes how I normally adjust the stop loss for a long trade and the opposite of this for a sell trade:
To show you how I use the above template to manage the stop in some of my most recent trade signals for the private group, here are a couple of real world examples:
Example 1: USD/CAD
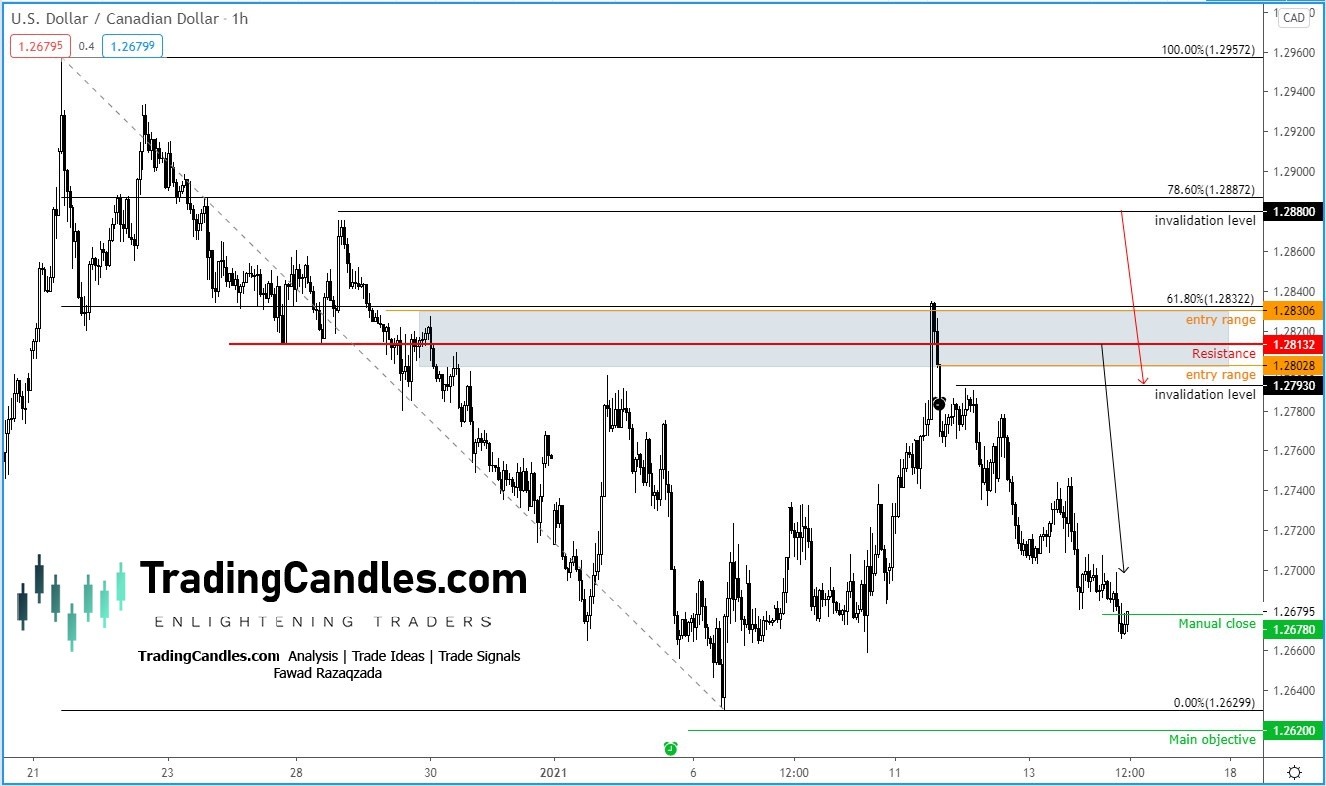
The USD/CAD was one of my recent trade signals. The idea was to sell the rallies into resistance in a downtrend. So, after a two- or three-day rebound into the bearish trend line, I thought it was the right time to issue a sell trade idea:
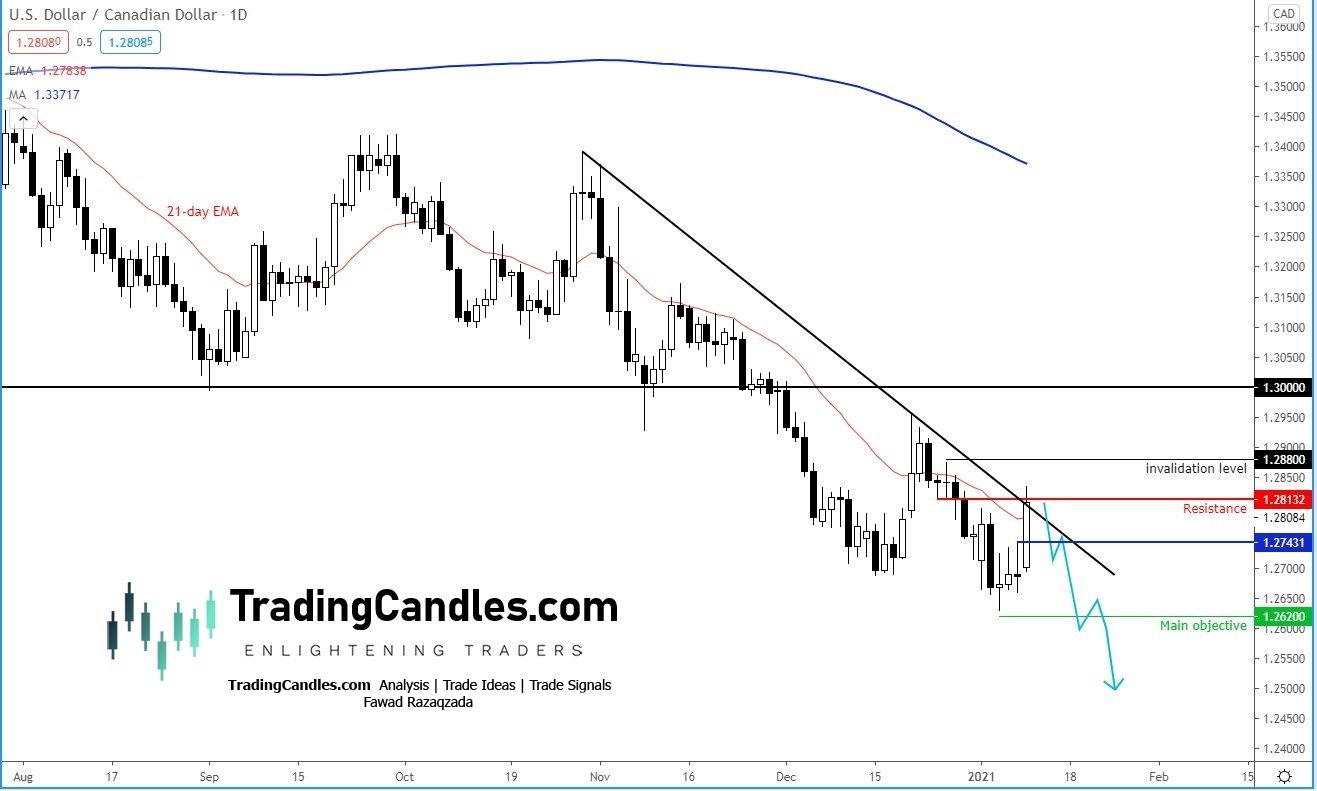
Source: TradingCandles.com and TradingView.com
In addition to the above chart, I posted the below hourly chart showing the specifics of the trade entry, as well a short rationale behind the idea:
"USD/CAD daily sows price reaching a potential resistance area (trend line and 21-day eMA) after a counter trend rebound off the lows. The long-term trend is bearish. So we will look for a sell setup here."
"USD/CAD short trade idea on H1 chart – the idea is based off the daily and the fact that on this timeframe rates have rallied to and stalled at the 61.8% Fibo. The invalidation level is above the most recent high on H1 and also the trend line above the daily. The main target is the liquidity below the recent low "
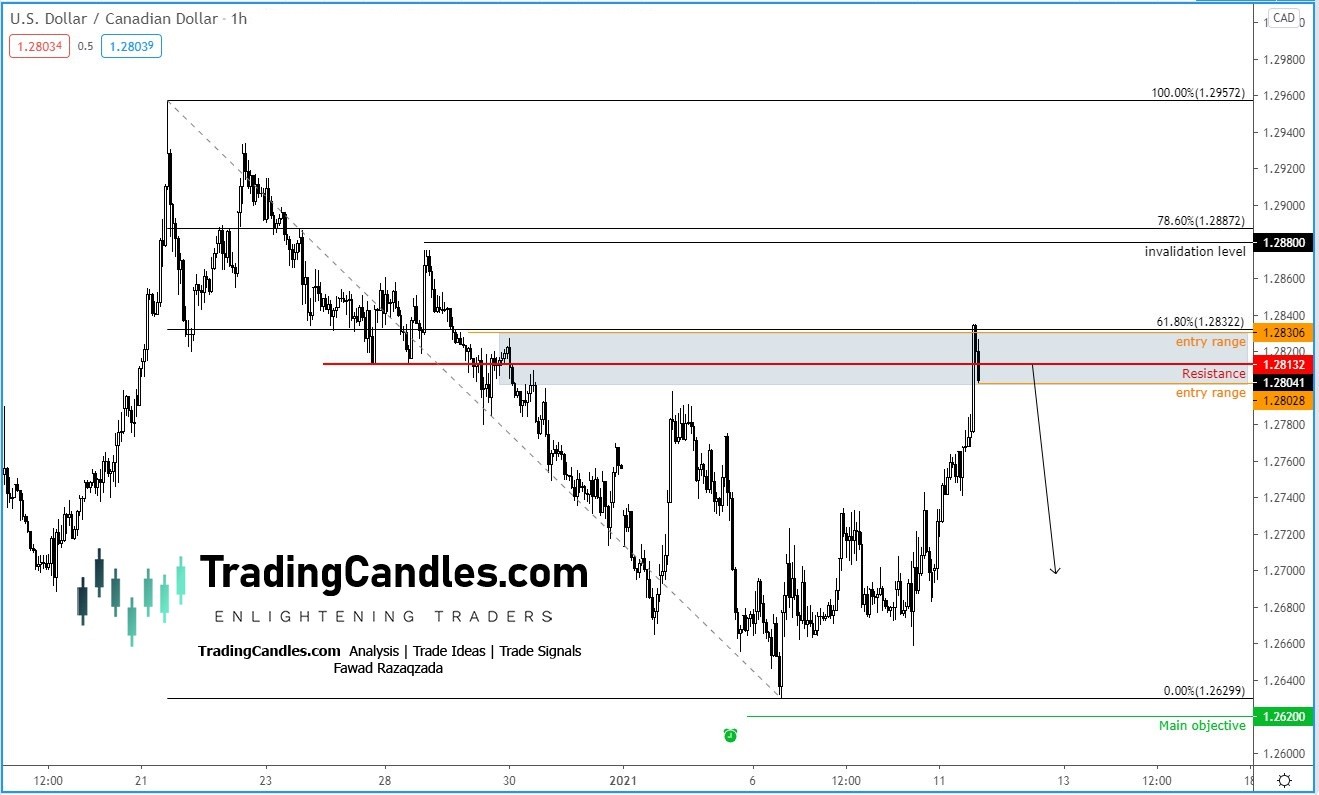
Source: TradingCandles.com and TradingView.com
After providing the above trade signal, rates started to go down as we had envisaged, prompting me to provide the following update, as my focus now was on reducing the risk (as we always do after entering a trade):
"USD/CAD update – lower the stop on this so we can lock in some profit as price has now created some structure below our entry range. It is important to continually monitor your positions, especially at times like now when the markets are all over the place. "
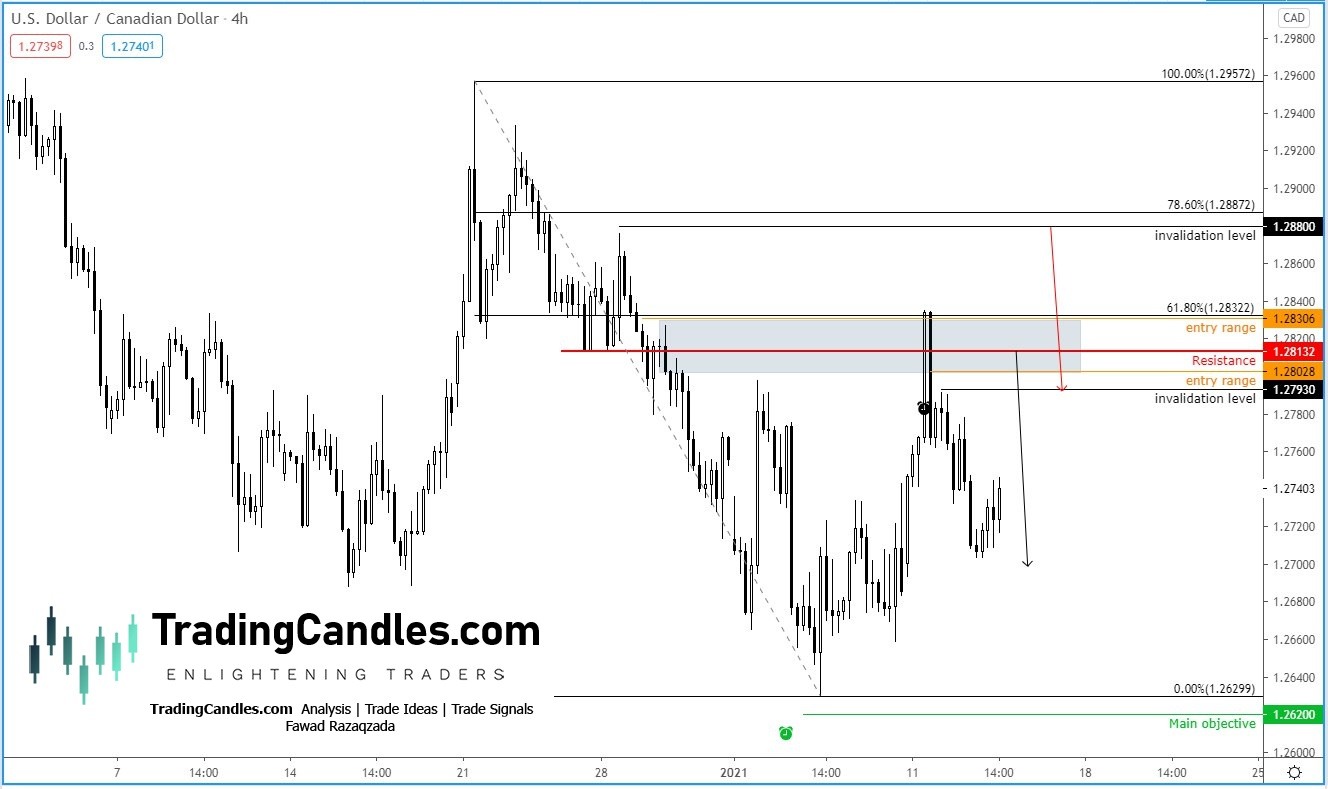
Source: TradingCandles.com and TradingView.com
As can be seen from the above 4-hour chart, the reason why I moved the stop lower was because of the fact price had created a structure of interim lower highs and lower lows. I did not take into account the entry range and didn't just move the stop loss just for the sake of moving it to breakeven or better. But there was good reason for us to do so, and price action told us when it was the right time.
As it happened, the USD/CAD stalled just ahead of our intended target, which, together with the fact the US dollar was weakening against some other currencies, meant it was probably the best time to close it manually. So I provided the following rationale and chart for the subscribers behind my decision to close it ahead of the target:
"USD/CAD closing it manually here for at least +125 pips profit. Oil prices have stalled and the US dollar has shown signs of life against some currencies already e.g. against euro and gold. So let's not take any chances and close this for a very good profit."
Source: TradingCandles.com and TradingView.com
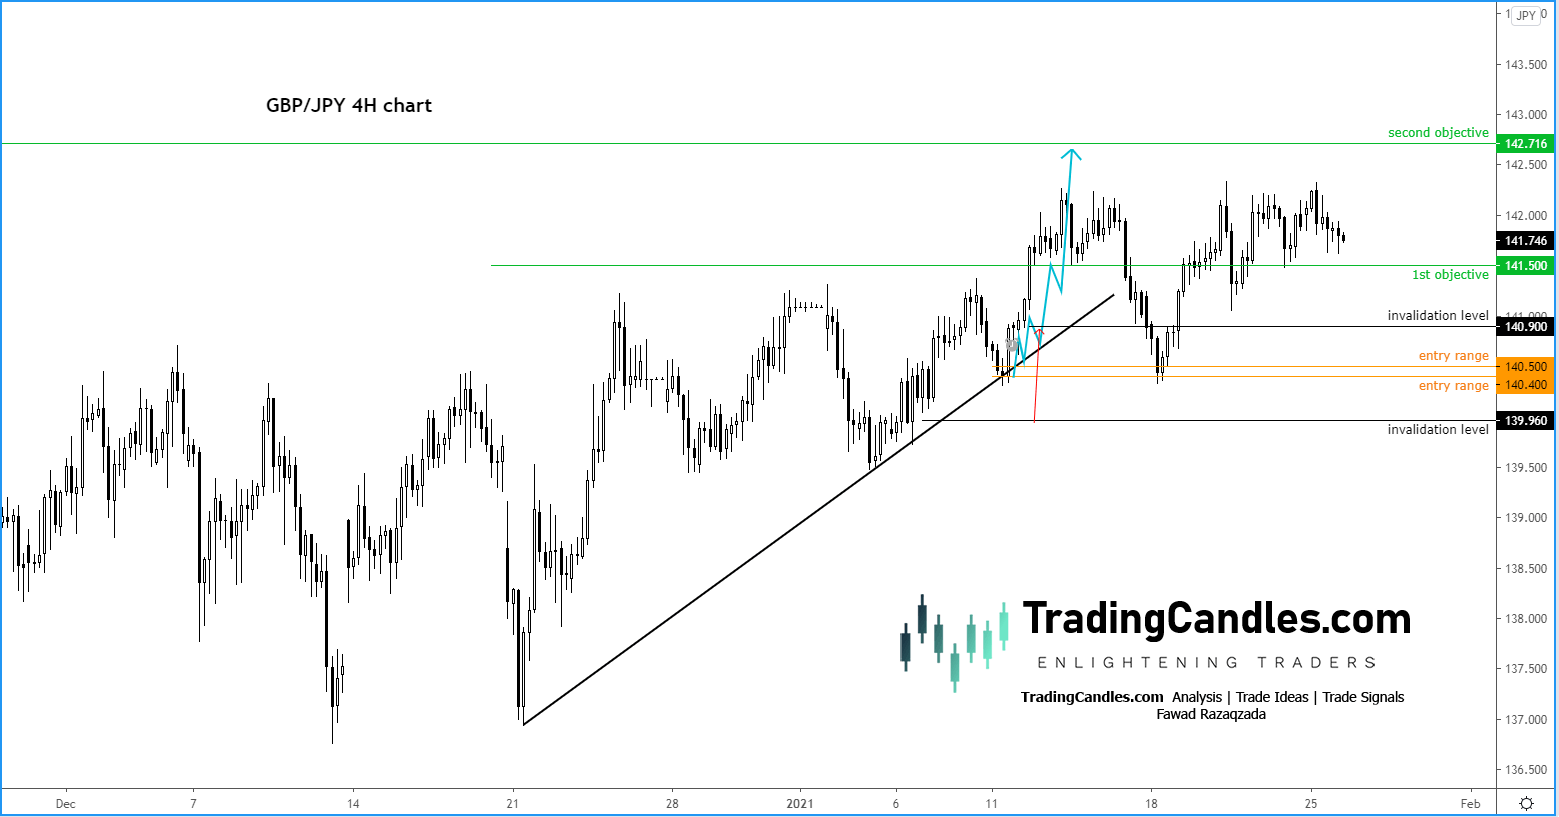
Example 2: GBP/JPY
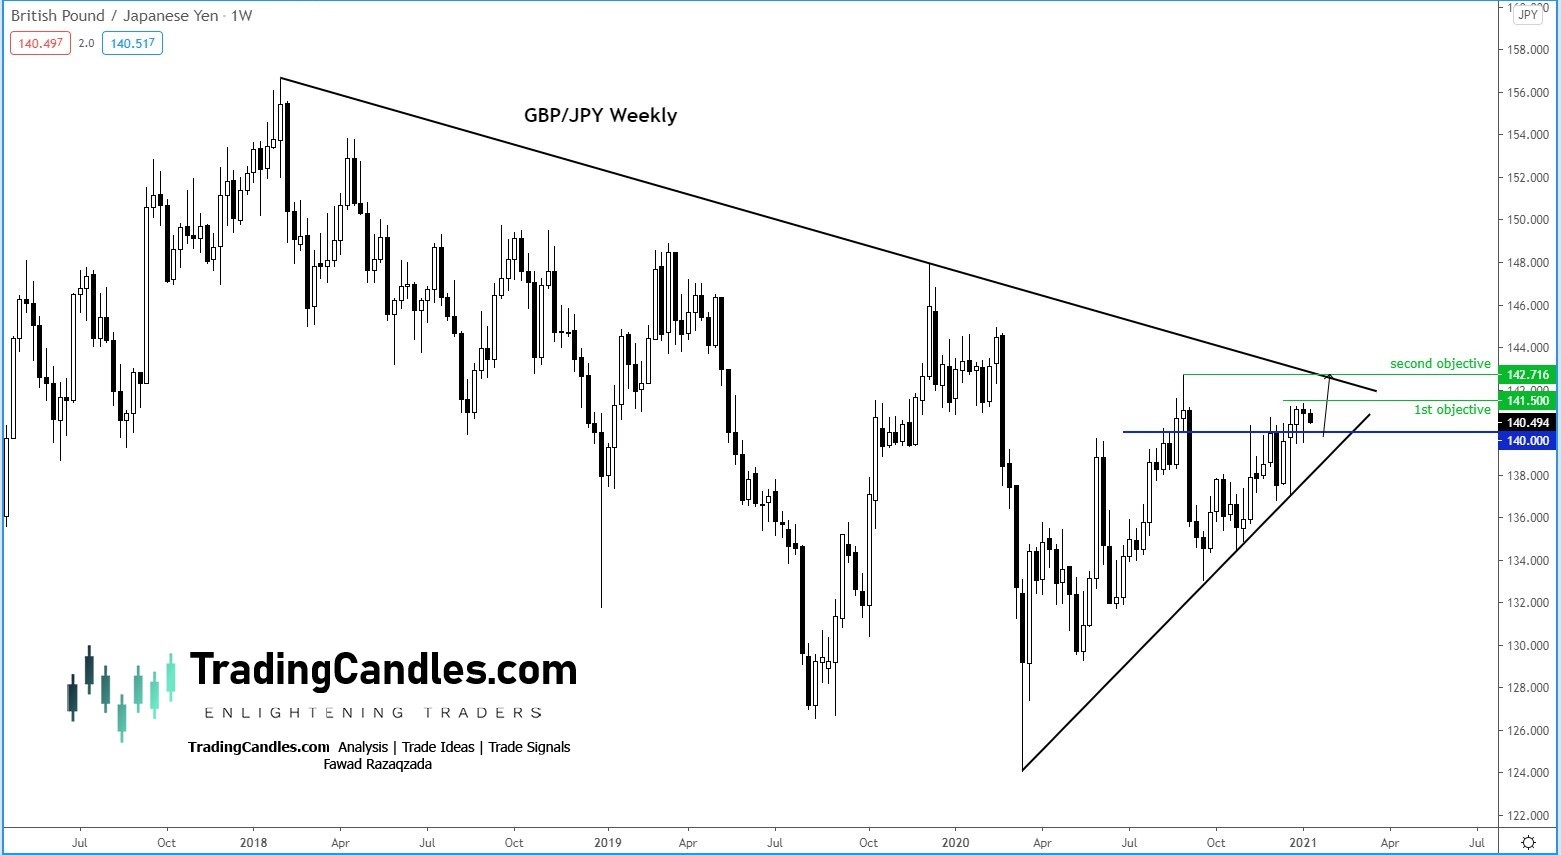
Another of our trade ideas which required management of the stop was the long GBP/JPY setup, which was issued on 11th January 2021. This is what I wrote to the group:
"GBP/JPY is looking quite bullish and think more gains are likely in my view as ongoing risk rally keeps the pressure on the safe haven yen and I think the pound will bounce back because no-deal Brexit has been avoided. The next key objective is the long-term bear trend and previous high around 142.71ish "
Source: TradingCandles.com and TradingView.com
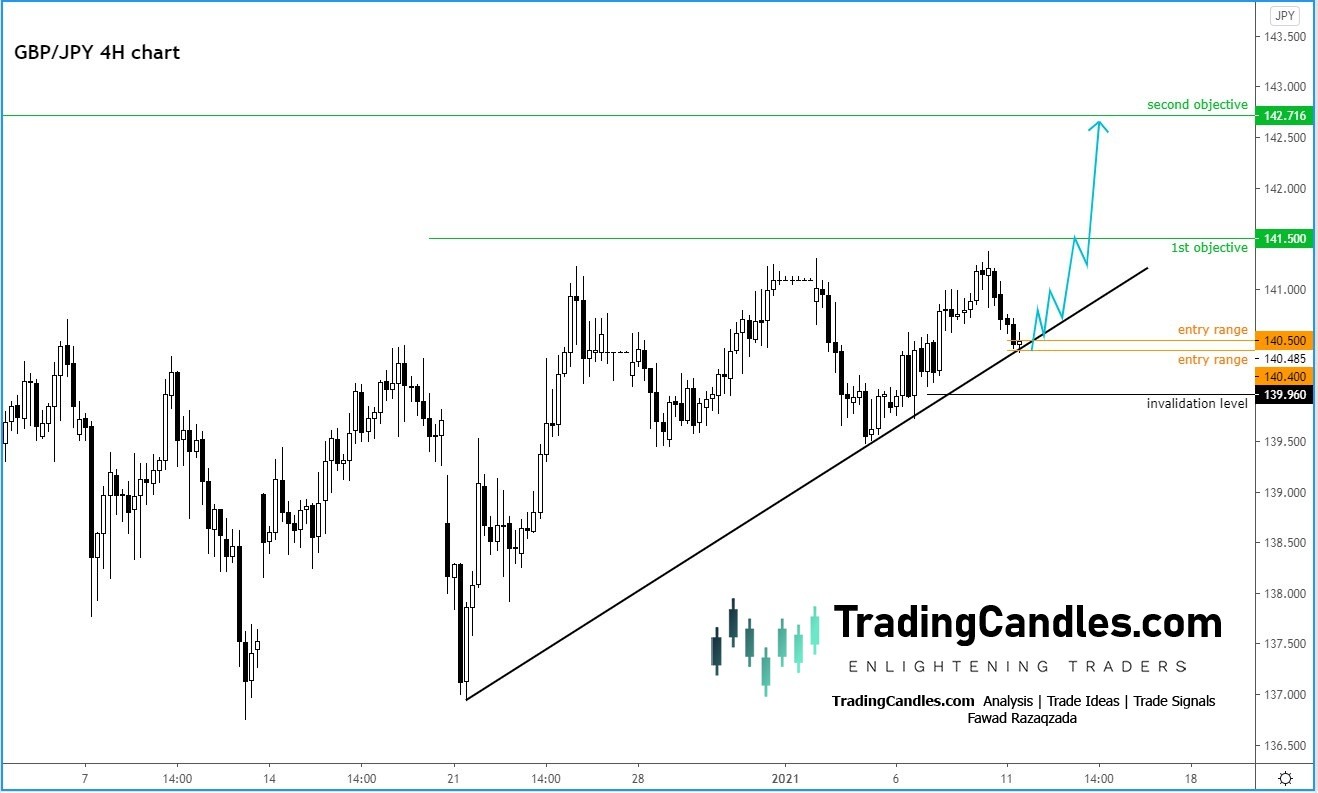
I then issued the specifics of the GBP/JPY long trade idea on the 4-hour chart as rates were testing the bullish trend line. The stop low below the most recent lows on 4H candles and thus the trend line:
Source: TradingCandles.com and TradingView.com
The GBP/JPY hit our first target for at least +100 pips and by now I had tightened the stop on the small portion still left open as shown on the updated chart to lock in some profit in case price reversed:
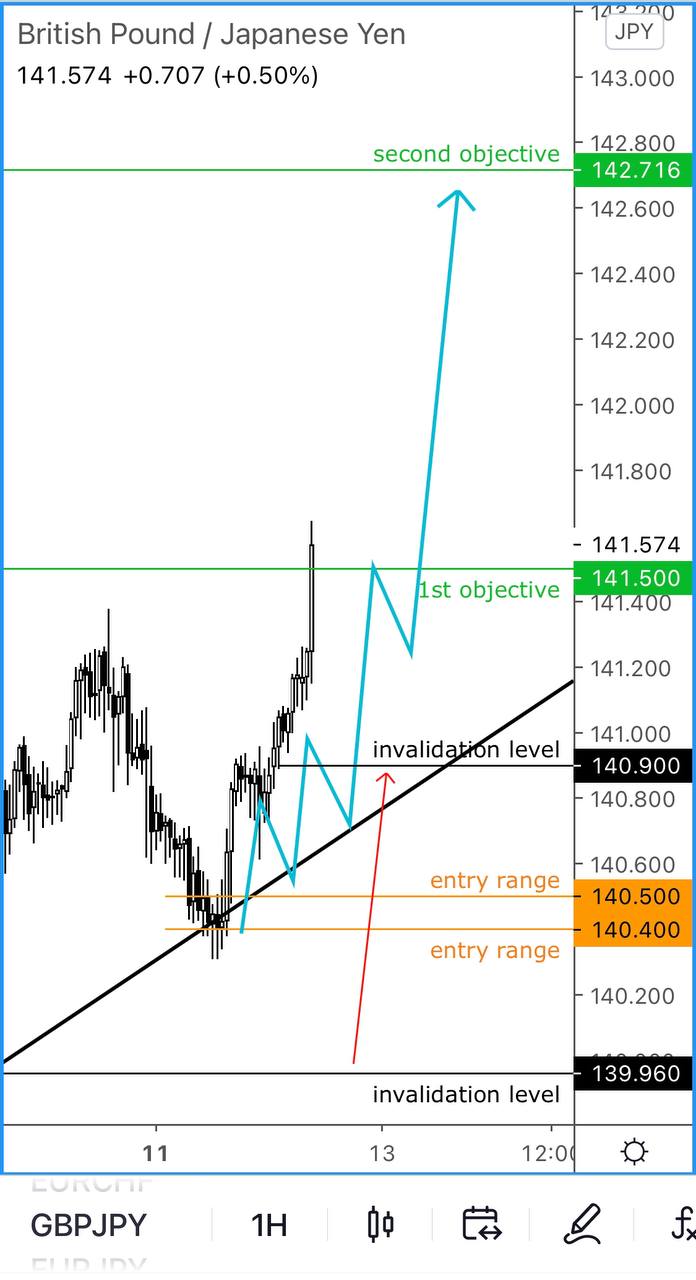
As it turned out, this trade reversed and stopped us out of the second portion (for a small profit). But on reflection, perhaps I shouldn't have adjusted the the stop too tightly as price subsequently rebounded again after re-testing our entry area:
Source: TradingCandles.com and TradingView.com
Final words
It is impossible to know ahead of time whether adjusting the stop loss is better than not doing anything at all. The way I see it is that you should adjust the stop loss as price action evolves and the market makes new price structures. On occasions, you might regret adjusting the stop loss. But essentially, what you want to do is reduce risk and remain in control of the trade. A small win is, after all, a win, and certainly not a loss. I would rather make a small win than lose a full 1R on any given trade.
Author

Fawad Razaqzada
TradingCandles.com
Experience Fawad is an experienced analyst and economist having been involved in the financial markets since 2010 working for leading global FX, CFD and Spread Betting brokerages, most recently at FOREX.com and City Index.


