Compliments of the most aggressive rate hike campaigns in US Central Bank history, we’ve seen a return to high-yield, low-risk assets. Investors have been flocking to the short end of the curve for good reason; the 2-year note backed by the perceived safety of the US government is yielding 5%! However, after last week’s selling pressure on the long end of the curve, the 10-year note and 30-year bond are paying investors over 4%. With the potential for capital gains in addition to yield, this could prove to be one of the best times in history to be a US bondholder.
Thus far in 2023, fixed income, and particularly long-dated Treasuries, have been held back by one of the best starts to the year for stock indices in history which attracted fresh investment dollars that might have otherwise gone toward fixed-income securities.
Widespread expectations for a recession and analyst forecasts for lower equities left investors and speculators on the wrong foot. Traditional investment portfolios were underweight equities coming into the year, and speculators recently held the largest net short position ever recorded in E-mini S&P 500 futures. We have seen most of the bearish speculative bets unwound and price action suggests that portfolio managers and individual investors gave into FOMO mentality (forcing money into stocks at elevated prices).
While we aren’t outright bearish stock indices, we believe most of the gains are already behind us. Since the Financial Crisis, investors have been spoiled with riches by non-stop government stimulus and easy-money policy. After 2009, S&P 500 total returns have exceeded 20%, an abnormally high number of times. Further, with gains of 31.5%, 18.4%, and 28.7% in 2018, 2020, and 2021 respectively, investors’ perception of normal is seemingly skewed. The long-term return in equities is in the 8 to 10% range, not the 20% to 30% range that many market participants appear to expect. This mentality has likely enticed sidelined dollars that would rationally be allocated to Treasuries to make their way into the stock market in search of higher returns. Yet, a normalization in equity returns to reflect the lack of government stimulus would leave a risk-free 4% yield (assuming held to maturity) with a reasonable chance of appreciation looking quite attractive. After all, the current yield for holding the S&P 500 is about 1.5%, with substantial downside risk and minimal upside profit potential.
In addition to simple risk/reward analysis, this premise is corroborated by a few peripheral factors; let’s take a look.
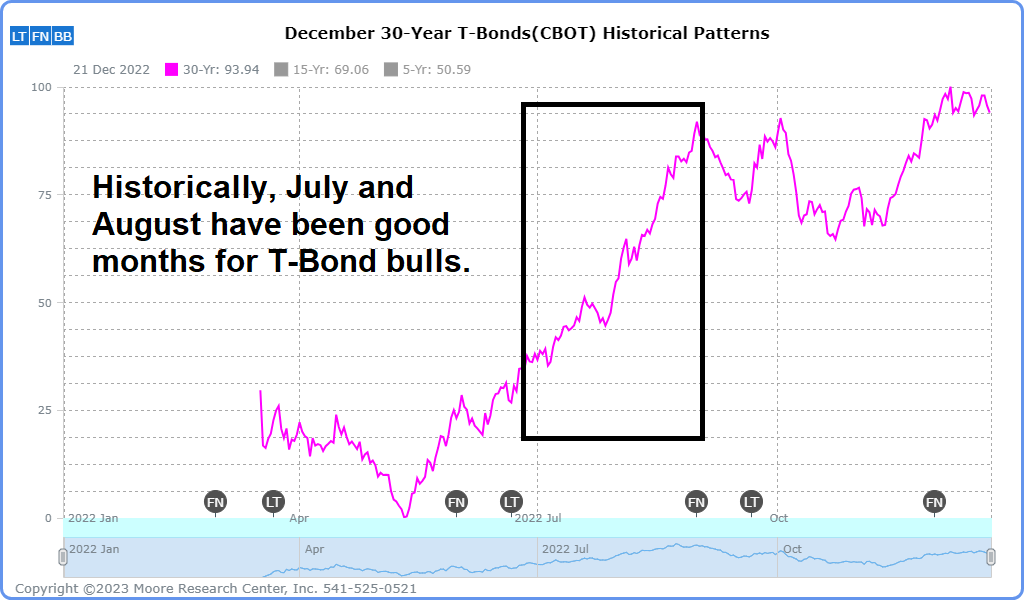
Seasonality
The Treasury market often relentlessly presses higher in July and August regardless of fundamentals. Thus far, the seasonal strength has been non-existent, but there are plenty of reasons for that to change.
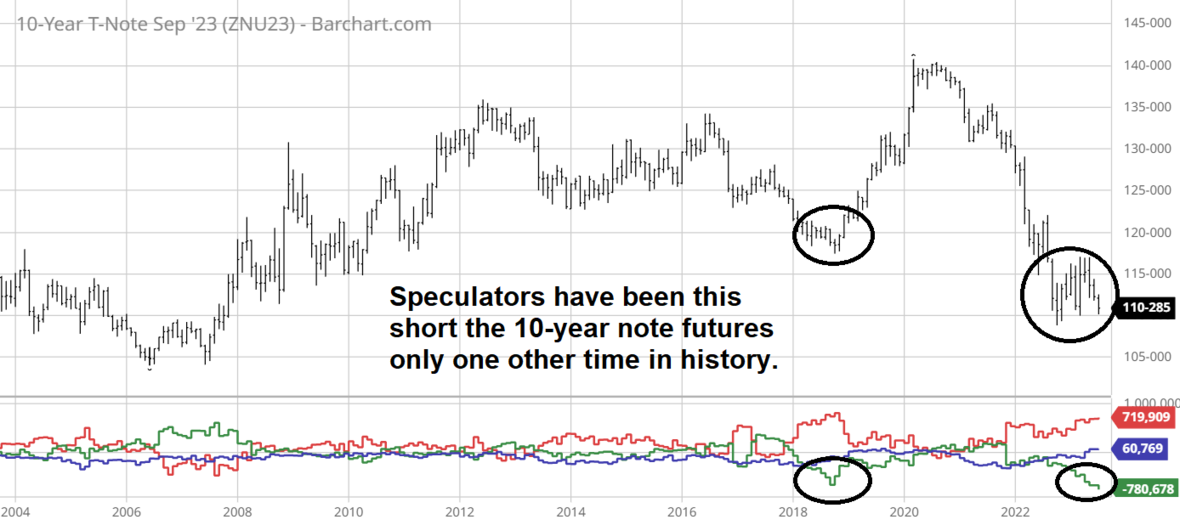
COT report
We are only aware of one other instance in which speculators in the futures markets were as aggressively short the 10-year note futures as they are today. In fact, according to the latest COT Report (Commitments of Traders) issued by the CFTC (Commodity Futures Trading Commission), large speculators are holding the largest net short position in history. In 2018, the net short holdings peaked at nearly 680,000 contracts. At this time, large speculators are holding about 780,000 net short contracts. Will we get a repeat of what we have witnessed in the E-mini S&P 500 in which the historically overcrowded bearish position unwound itself, causing an unusual rally? We think so.
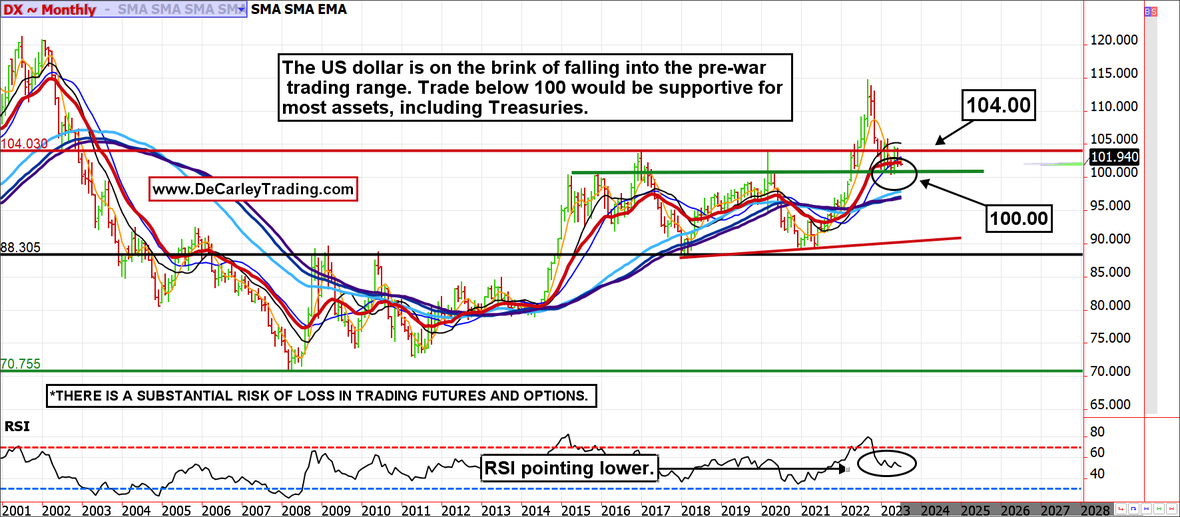
US Dollar weakness
All else being equal, a lower US dollar promotes higher US-denominated asset prices. The dollar index is on the brink of falling back into the pre-Ukraine-war trading range. A decline and weekly close below 100.00 would seal the deal for a weaker dollar; this would act as a tailwind for most assets, particularly Treasuries.
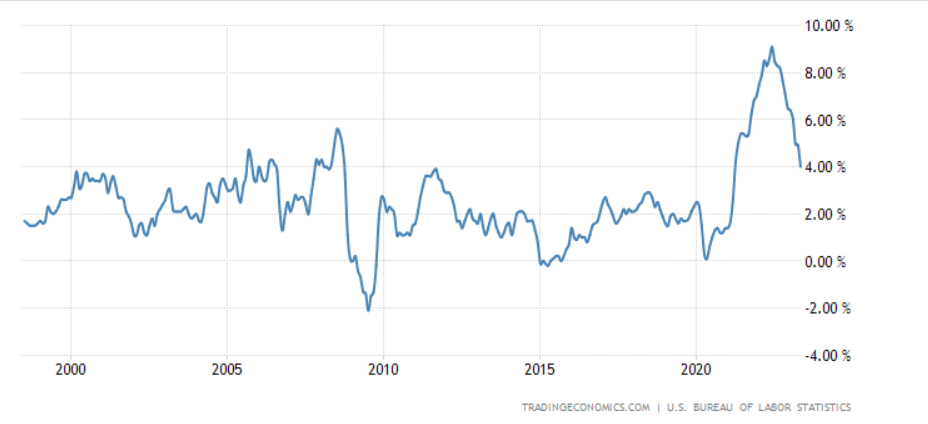
Inflation
The idea of runaway inflation ignited the original bond massacre of 2022. A year later, we know that inflation was peaking at precisely the time the markets were the most convinced the inflation cat was out of the bag and couldn’t be tamed. Inflation at 4% to 5% is still high compared to recent history, but in a world without aggressively loose monetary policy, 2% to 4% was considered acceptable. Perhaps we are simply falling back into a pre-Financial Crisis world of moderate inflation. With this in mind, it is fair to assume Treasuries are probably underpriced.
Conclusion
The stars are aligning for a contrarian trade in Treasuries. With the CPI on tap in the coming days, there is room for near-term volatility, but the inflation trend has been lower, and there are few signs of that trend changing. Shipping container pricing has subsided, commodity markets have displayed deflationary behavior, and the CPI has consistently declined. Perhaps the masses are positioned on the wrong side of the market at the wrong time.
Get Full Access To Our Premium Elliott Wave Analysis For 14 Days. Click here.
By using Wavetraders website, any services, products, and content contained here, you agree that use of our service is entirely at your own risk. You understand that there is a very high degree of risk involved in trading on the markets. We assume no responsibility or liability for your trading and investment results. The charts, and all articles published on www.wavetraders.com are provided for informational and educational purposes only!
By using the information and services of www.ew-forecast.com you assume full responsibility for any and all gains and losses, financial, emotional or otherwise, experienced, suffered or incurred by you.
Editors’ Picks

EUR/USD keeps the rangebound trade near 1.1850
EUR/USD is still under pressure, drifting back towards the 1.1850 area as Monday’s session draws to a close. The modest decline in spot comes as the US Dollar picks up a bit of support, while thin liquidity and muted volatility, thanks to the US market holiday, are exaggerating price swings and keeping trading conditions choppy.

GBP/USD flirts with daily lows near 1.3630
GBP/USD has quickly given back Friday’s solid gains, turning lower at the start of the week and drifting back towards the 1.3630 area. The focus now shifts squarely to Tuesday’s UK labour market report, which is likely to keep the quid firmly in the spotlight and could set the tone for Cable’s next move.

USD/JPY advances on weak Japanese GDP, holiday-thinned trading
USD/JPY rises while US and Japanese markets remain closed for holidays. Weak Japanese Gross Domestic Product figures curb tightening expectations. Investors await speeches from Federal Reserve Vice Chair for Supervision.
Editors’ Picks

AUD/USD retargets 0.7100 ahead of RBA Minutes
AUD/USD keeps the slightly bid bias around 0.7070 ahead of the opening bell in Asia. Indeed, the pair reverses two daily pullbacks in a row, meeting some initial contention around 0.7050 while investors gear up for the release of the RBA Minutes early on Tuesday.
EUR/USD keeps the rangebound trade near 1.1850
EUR/USD is still under pressure, drifting back towards the 1.1850 area as Monday’s session draws to a close. The modest decline in spot comes as the US Dollar picks up a bit of support, while thin liquidity and muted volatility, thanks to the US market holiday, are exaggerating price swings and keeping trading conditions choppy.

Gold battle around $5,000 continues
Gold is giving back part of Friday’s sharp rebound, deflating below the key $5,000 mark per troy ounce as the new week gets underway. Modest gains in the US Dollar are keeping the metal in check, while thin trading conditions, due to the Presidents Day holiday in the US, are adding to the choppy and hesitant tone across markets.

AI Crypto Update: Bittensor eyes breakout as AI tokens falter
The artificial intelligence (AI) cryptocurrency segment is witnessing heightened volatility, with top tokens such as Near Protocol (NEAR) struggling to gain traction amid the persistent decline in January and February.

The week ahead: Key inflation readings and why the AI trade could be overdone
It is likely to be a quiet start to the week, with US markets closed on Monday for Presidents Day. European markets are higher across the board and gold is clinging to the $5,000 level after the tamer than expected CPI report in the US reduced haven flows to precious metals.
RECOMMENDED LESSONS
Making money in forex is easy if you know how the bankers trade!
I’m often mystified in my educational forex articles why so many traders struggle to make consistent money out of forex trading. The answer has more to do with what they don’t know than what they do know. After working in investment banks for 20 years many of which were as a Chief trader its second knowledge how to extract cash out of the market.
5 Forex News Events You Need To Know
In the fast moving world of currency markets where huge moves can seemingly come from nowhere, it is extremely important for new traders to learn about the various economic indicators and forex news events and releases that shape the markets. Indeed, quickly getting a handle on which data to look out for, what it means, and how to trade it can see new traders quickly become far more profitable and sets up the road to long term success.
Top 10 Chart Patterns Every Trader Should Know
Chart patterns are one of the most effective trading tools for a trader. They are pure price-action, and form on the basis of underlying buying and selling pressure. Chart patterns have a proven track-record, and traders use them to identify continuation or reversal signals, to open positions and identify price targets.
7 Ways to Avoid Forex Scams
The forex industry is recently seeing more and more scams. Here are 7 ways to avoid losing your money in such scams: Forex scams are becoming frequent. Michael Greenberg reports on luxurious expenses, including a submarine bought from the money taken from forex traders. Here’s another report of a forex fraud. So, how can we avoid falling in such forex scams?
What Are the 10 Fatal Mistakes Traders Make
Trading is exciting. Trading is hard. Trading is extremely hard. Some say that it takes more than 10,000 hours to master. Others believe that trading is the way to quick riches. They might be both wrong. What is important to know that no matter how experienced you are, mistakes will be part of the trading process.
The challenge: Timing the market and trader psychology
Successful trading often comes down to timing – entering and exiting trades at the right moments. Yet timing the market is notoriously difficult, largely because human psychology can derail even the best plans. Two powerful emotions in particular – fear and greed – tend to drive trading decisions off course.