What is a bond and how does it relate to a yield curve?

The basics of what a bond is
Think of a bond simply as a type of loan. It is a loan taken out by Governments and companies. When Governments and very large companies want to borrow money they can’t easily go to a bank because of the huge amounts of money involved. So, a bond is a mechanism by which a Government or large corporation borrows money for their needs. The bond is issued for a set period of time. Bonds can be purchased for different lengths of time from short-term, medium-term, and long-term bonds. Short-term bonds are only for a year or two, medium-term bonds are up to 10 years, and long-term bonds are generally 10 years or longer. These bonds have a coupon or yield rate.
Understanding what a yield is on a bond
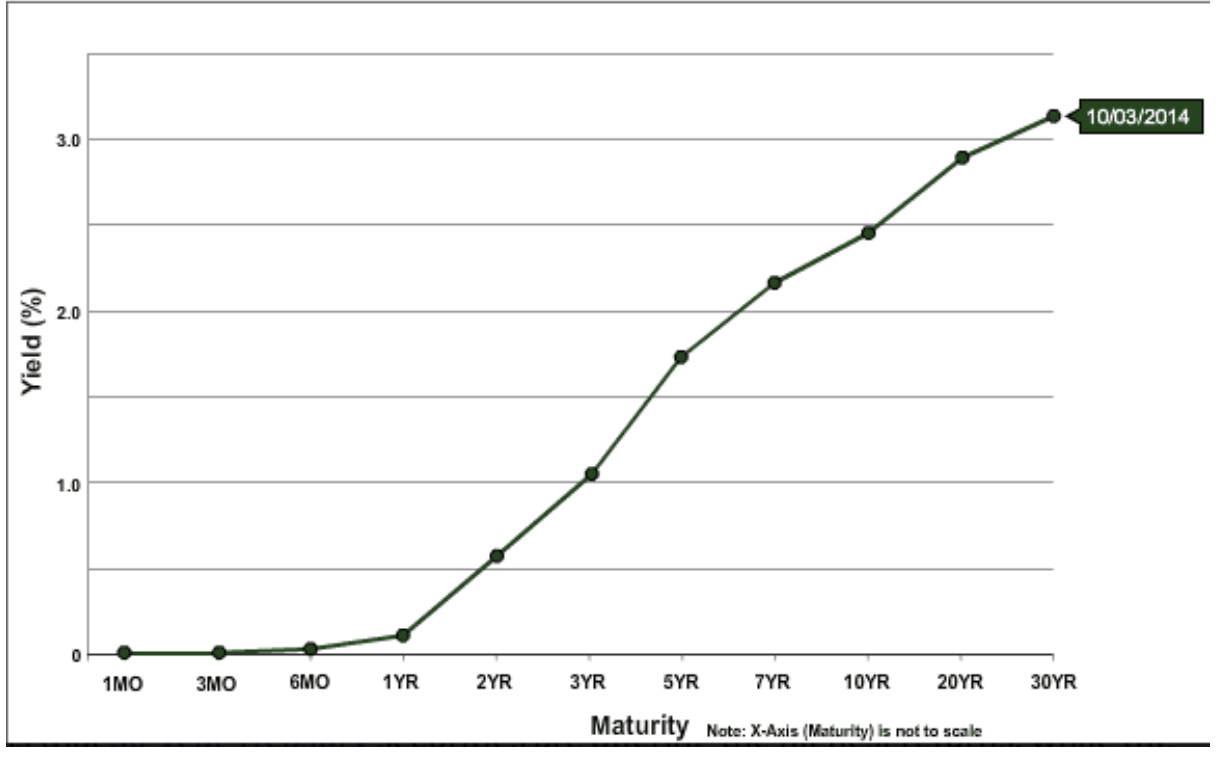
As an incentive to loan money to the Government or a large company the bond has a yield. The yield is an agreed interest payment on the value of the loan. So, for example, say you purchased a UK bond for £1000 with a yield of 5%, referred to as a coupon, you would receive £50 for each year you held the bond. Then, when the bond expires, you would receive back the original value you purchased the bond for. So, to be clear, the graph below shows a ‘yield curve’. The black dots on the chart show the ‘yields or coupons’ for each bond. The 3YR bond is showing a yield just above 1%. The 7YR bond is showing a yield of just above 2% and the 30YR bond has a yield of just over 3%. The dots are joined together and that creates what is known as the ‘yield curve’.
Author

Giles Coghlan LLB, Lth, MA
Financial Source
Giles is the chief market analyst for Financial Source. His goal is to help you find simple, high-conviction fundamental trade opportunities. He has regular media presentations being featured in National and International Press.


