There are many dangers inherently found when investing or trading in the equity markets. But what increases your risk is not knowing how to identify or avoid the many traps purposely set up to take your money. One such trap is the Bear Trap in Stocks.

Markets move higher because of an imbalance between buying and selling pressure. For example, when there are a lot of people wanting to buy but no sellers to match them at the current price. In this instance, to attract sellers, the buyers will raise their bids, (the price they are willing to pay for the stock). The higher price is likely to attract sellers to meet the demand.

The problem is that when anyone buys a stock, they automatically become selling pressure on that stock. Remember, once you own a stock, you only profit from it once you sell it (unless you earn dividends on the stock). So, if too many people buy the stock, it will diminish the buying pressure and increase the potential selling pressure.

What is a Bear Trap?

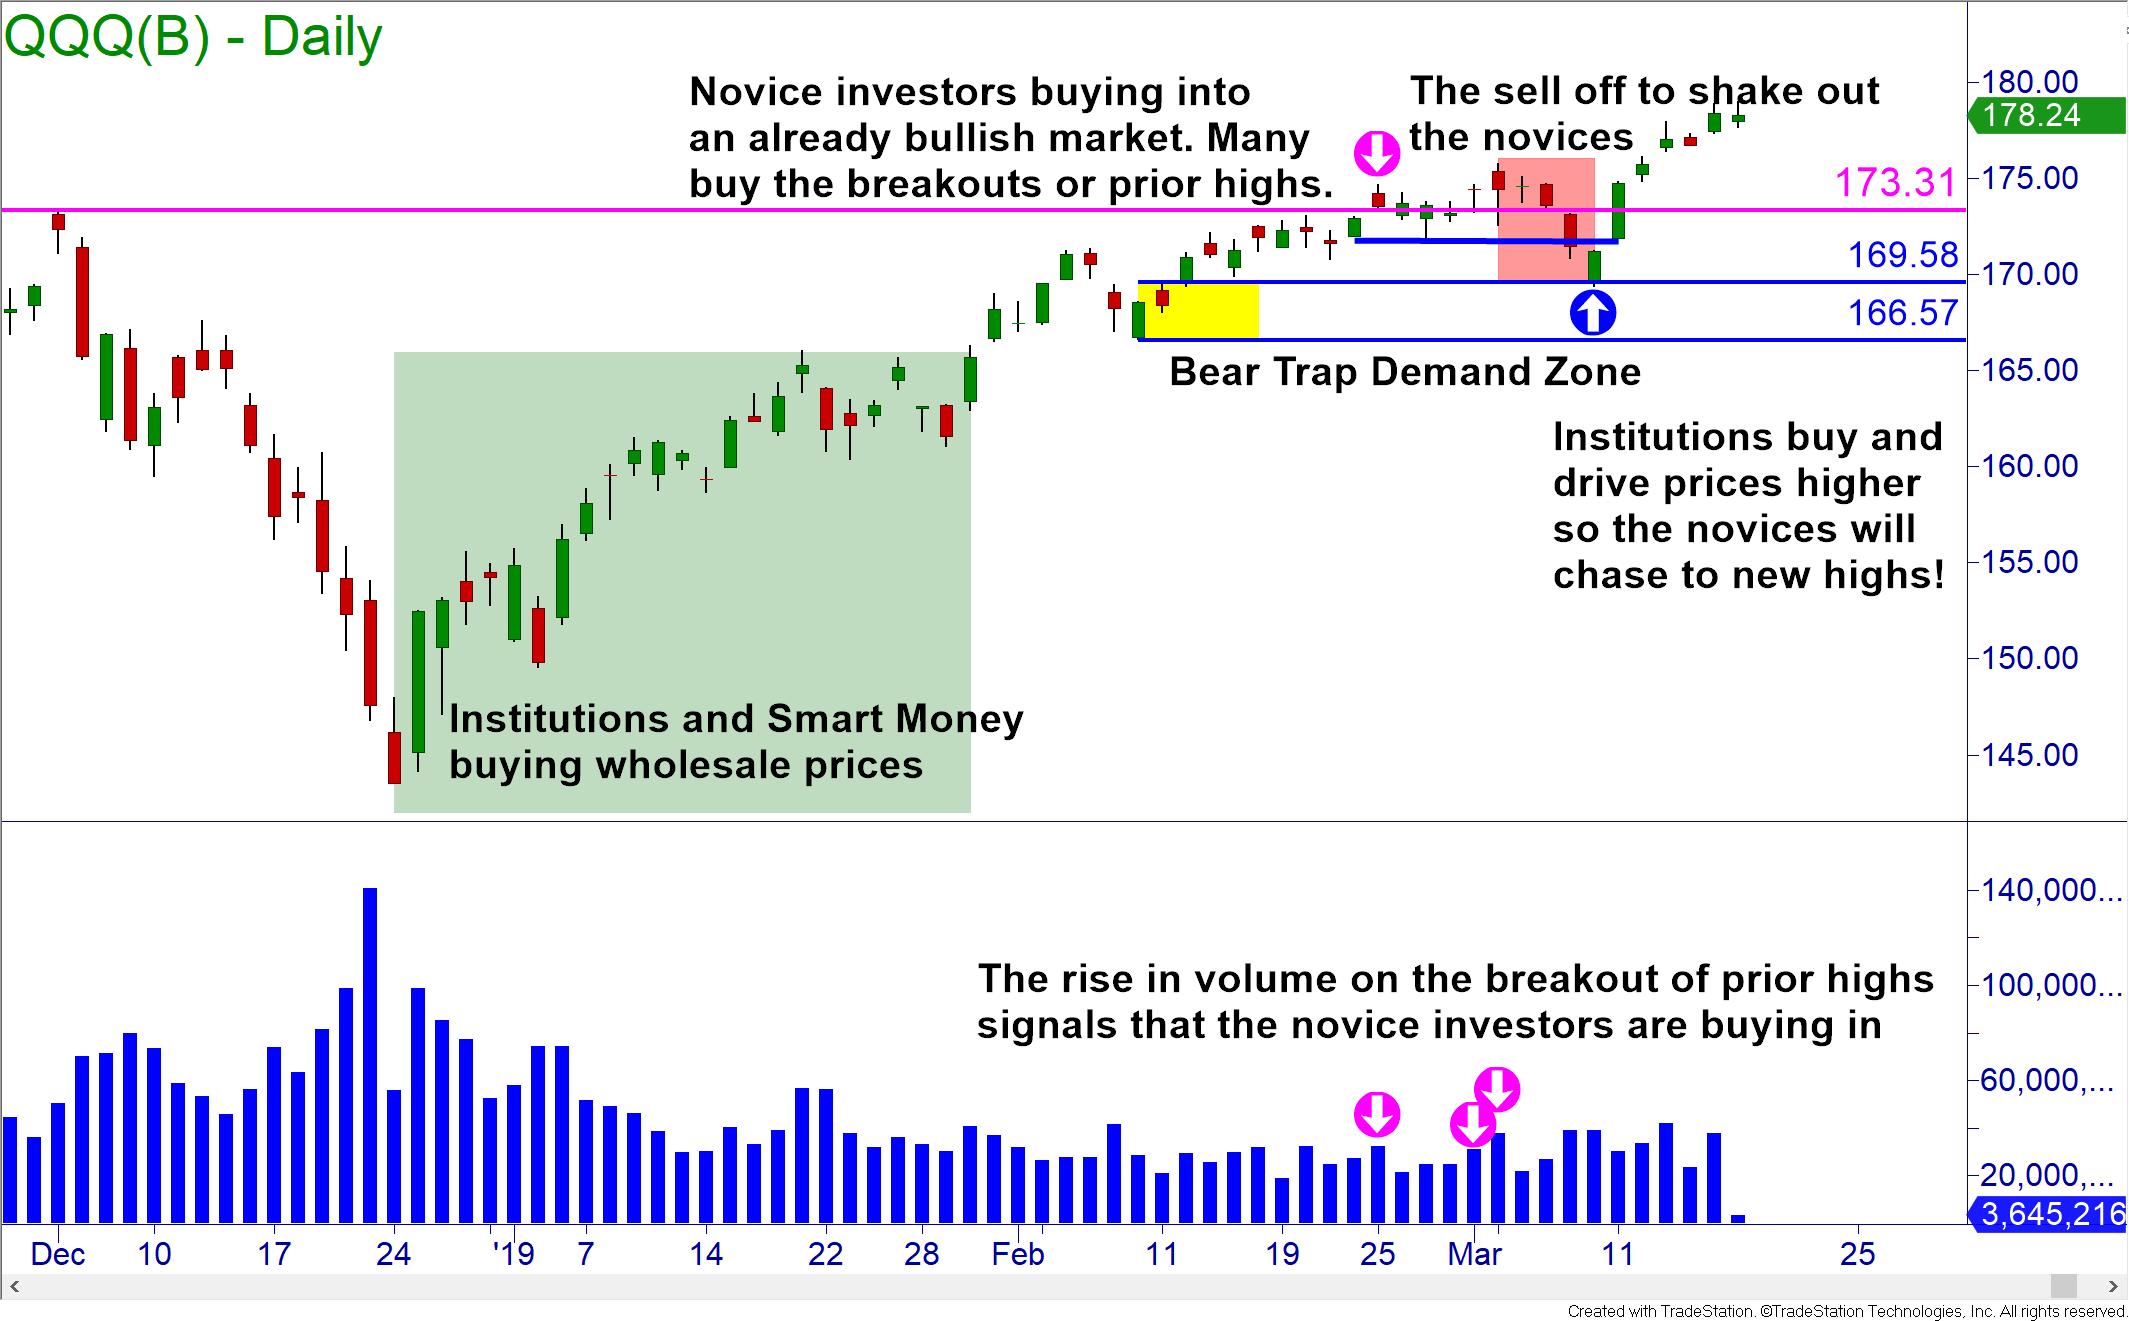
In order to create more demand and get the prices of stocks to move higher, institutions need to shake out the amateur/novice traders. They do this by pushing prices lower to make it seem like the stock or the markets are becoming bearish. The fear of losing their small profits, or of losing money in general, will force the novices into selling their stocks. Once a trader has been stopped out or tricked into selling their stock, they will frequently jump back in if they see the prices moving upwards beyond the price that they had originally bought in. This, in turn, creates more demand and drives the prices higher just as the institutions wanted.

When to Expect a Bear Trap

Institutions buy stocks at wholesale prices, usually after they drop. This will cause downtrends to reverse and markets to rise. This is the best time to buy, but many amateur and novice investors and traders wait and buy once they see that prices are already bullish. Worse yet, many people are taught to buy breakouts and chase price as it moves higher. This signals to the institutions that it may be time to set the bear trap on the stock. When you see an increase of volume accompanying a breakout in price, a bear trap is usually not far off.

chart

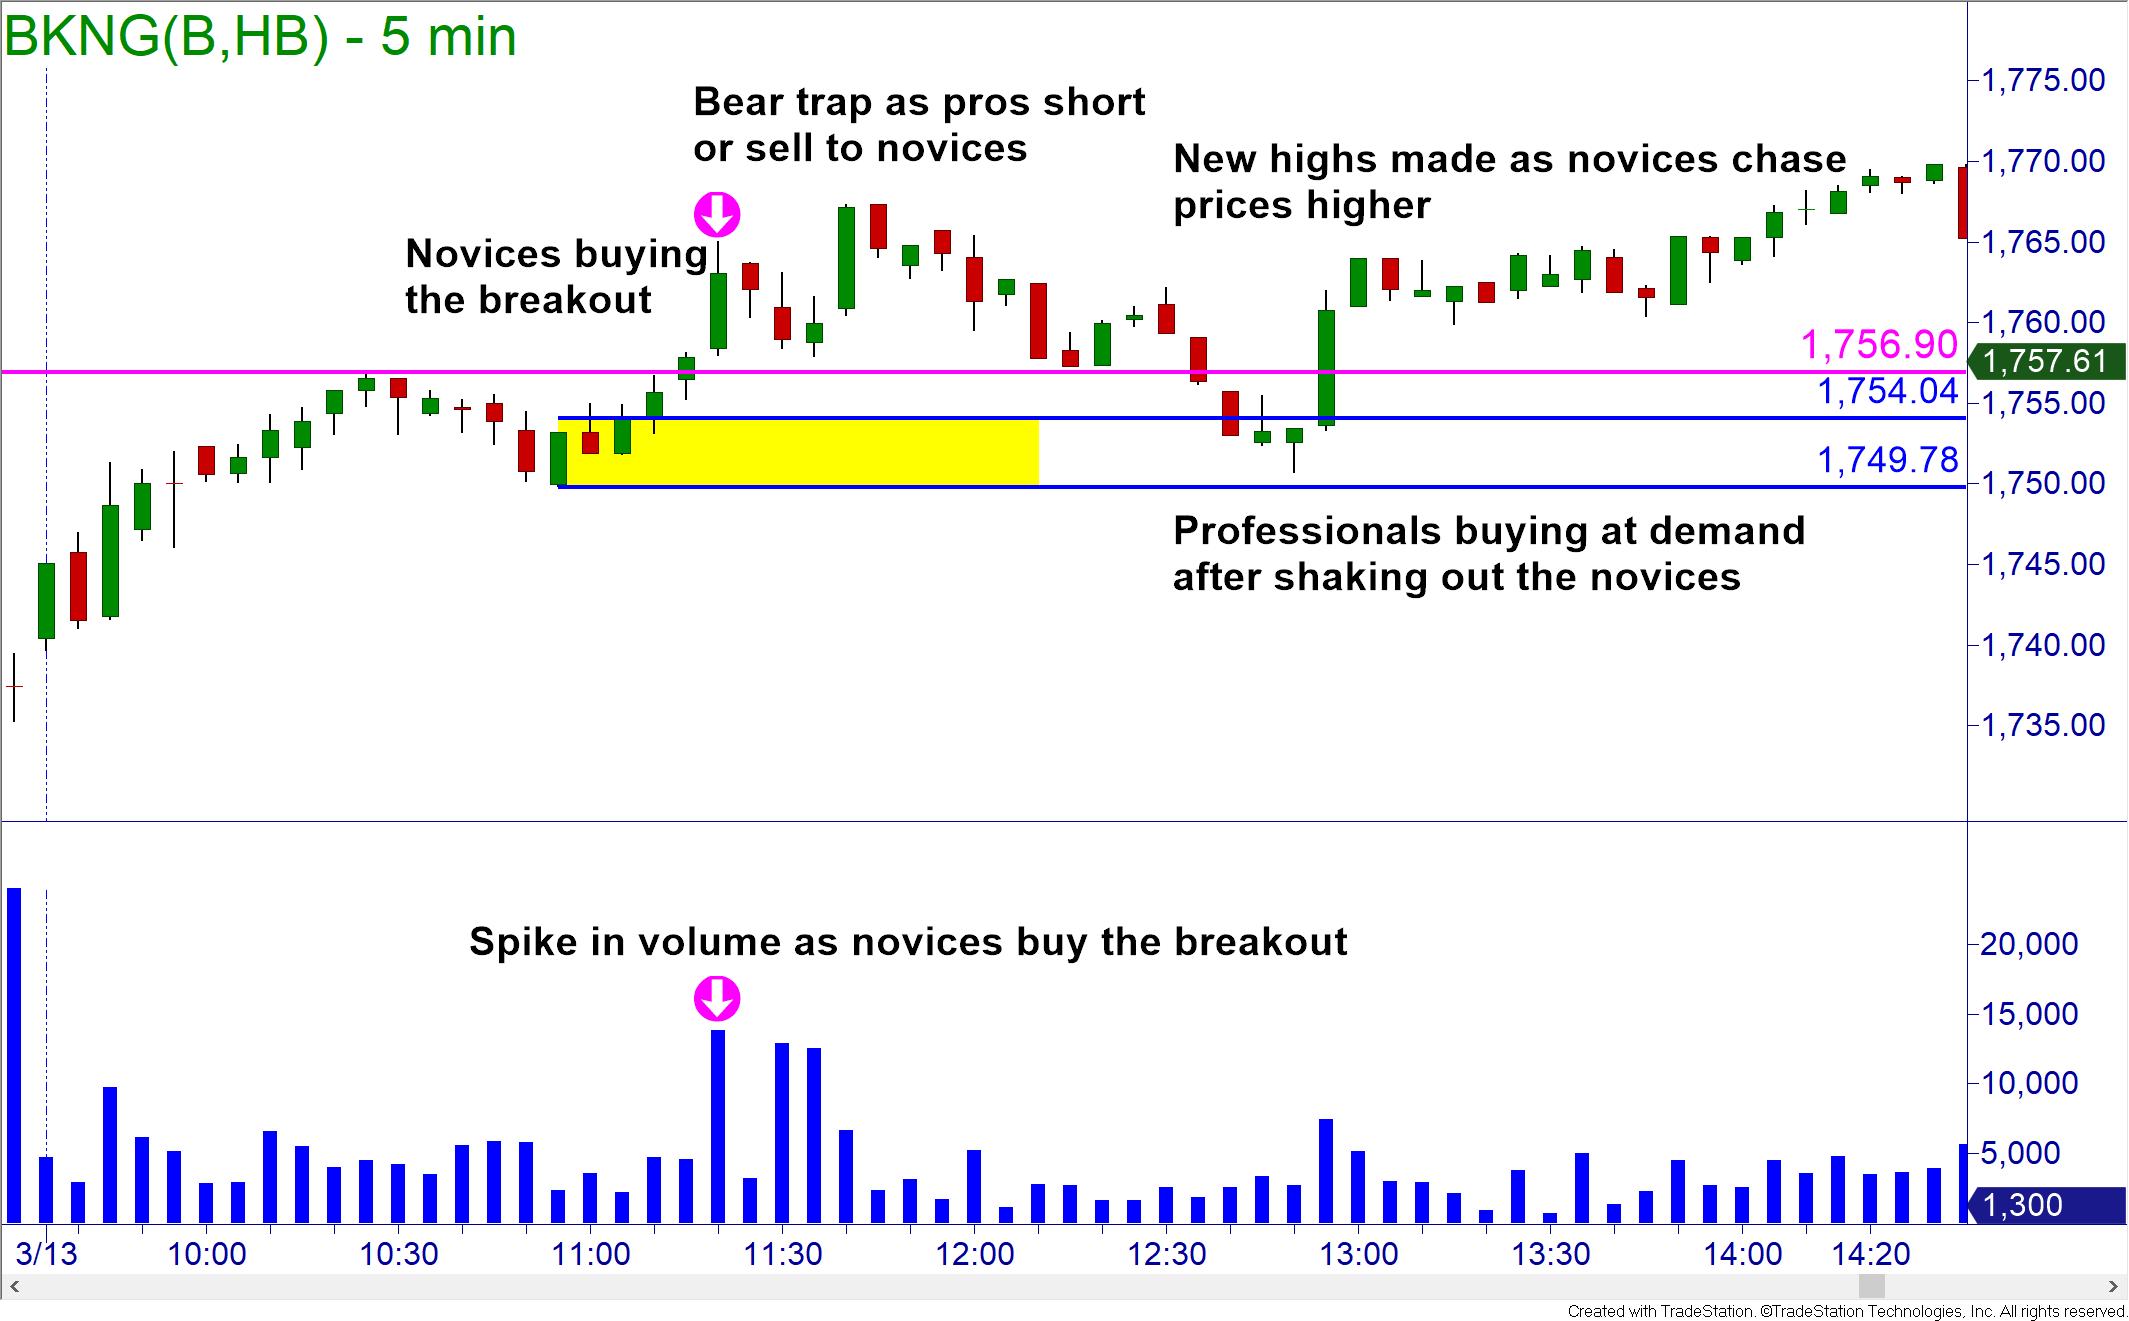
Bear traps on stocks can also be found on intraday charts. The same setup is usually observed, prices breaking out to fresh highs where institutions will sell or short sell to the novices buying the breakout. This halts the upward movement and scares the novices into panic, causing them to sell their stock or triggering their stops. Once the price drops into demand, the institutions buy to cover their shorts and send prices higher where novices will jump back in for fear of missing out.

chart

How to Trade a Bear Trap

To be profitable in the markets, you want to trade like a professional. Bear traps on stocks are usually set in the same circumstances as those described above. Now that you know what the professionals are looking for to set the bear trap and how they trade them, you could trade and invest right alongside of the smart money.

If you follow OTA’s Core Strategy, you have a set of rules and will trade and invest with the dominant trend and quality demand and supply zones. There are also Bull Traps that can be a danger or an opportunity for traders. To learn more about the Core Strategy and/or other market traps and opportunities, visit your local Online Trading Academy Center today.

Read the original article here - What is a Bear Trap on the Stock Market?


Learn to Trade Now


Neither Freedom Management Partners nor any of its personnel are registered broker-dealers or investment advisers. I will mention that I consider certain securities or positions to be good candidates for the types of strategies we are discussing or illustrating. Because I consider the securities or positions appropriate to the discussion or for illustration purposes does not mean that I am telling you to trade the strategies or securities. Keep in mind that we are not providing you with recommendations or personalized advice about your trading activities. The information we are providing is not tailored to any individual. Any mention of a particular security is not a recommendation to buy, sell, or hold that or any other security or a suggestion that it is suitable for any specific person. Keep in mind that all trading involves a risk of loss, and this will always be the situation, regardless of whether we are discussing strategies that are intended to limit risk. Also, Freedom Management Partners’ personnel are not subject to trading restrictions. I and others at Freedom Management Partners could have a position in a security or initiate a position in a security at any time.

Editors’ Picks

EUR/USD trades with negative bias around 1.1730 amid recovering USD; downside seems limited

EUR/USD trades with negative bias around 1.1730 amid recovering USD; downside seems limited

The EUR/USD pair kicks off the new week on a softer note, though it remains within striking distance of the highest level since early October, touched last Thursday. Spot prices currently trade around the 1.1730 region, down less than 0.10% for the day.

GBP/USD holds steady above mid-1.3300s as traders await key data and BoE this week

GBP/USD holds steady above mid-1.3300s as traders await key data and BoE this week

The GBP/USD pair remains on the defensive during the Asian session on Monday, though it lacks bearish conviction and holds above the 200-day Simple Moving Average pivotal support. Spot prices currently trade around the 1.3360 region, nearly unchanged for the day.

USD/JPY extends losses below 155.50 amid Fed-BoJ monetary policy divergence

USD/JPY extends losses below 155.50 amid Fed-BoJ monetary policy divergence

USD/JPY drops further below 155.50 in the Asian session on Monday. The pair remains offered as the Japanese Yen continues to draw support from the expectations of Fed-BoJ monetary policy divergence and a risk-off market profile. Fedspeak is next in focus.


Editors’ Picks

AUD/USD hovers around 0.6650, unfazed by poor China's activity data

AUD/USD hovers around 0.6650, unfazed by poor China's activity data

AUD/USD is keeping its range around 0.6650 in Monday's Asian trading. little affected by downbeat China's activity data for November. The country's Retail Sales, Fixed Asset Investment and Industrial Production data came in below forecasts and refuelled economic growth concerns. 

USD/JPY extends losses below 155.50 amid Fed-BoJ monetary policy divergence

USD/JPY extends losses below 155.50 amid Fed-BoJ monetary policy divergence

USD/JPY drops further below 155.50 in the Asian session on Monday. The pair remains offered as the Japanese Yen continues to draw support from the expectations of Fed-BoJ monetary policy divergence and a risk-off market profile. Fedspeak is next in focus.

Gold retains bullish bias ahead of this week’s key US macro releases

Gold retains bullish bias ahead of this week’s key US macro releases

Gold attracts buyers for the fifth straight day and climbs to the $4,330 region during the Asian session on Monday. The commodity remains well within striking distance of its highest level since October 21, touched on Friday, and seems poised to appreciate further amid a supportive fundamental backdrop. 

Top Crypto Losers: DASH, SPX, PENGU – Privacy and meme coins lose ground

Top Crypto Losers: DASH, SPX, PENGU – Privacy and meme coins lose ground

Altcoins, including Dash, SPX6900, and Pudgy Penguins, are leading losses as the broader cryptocurrency market remains cautious ahead of the macroeconomic data releases, such as the US Nonfarm payroll report, CPI data, and the Bank of Japan’s rate-hike decision.

Big week ends with big doubts

Big week ends with big doubts

The S&P 500 continued to push higher yesterday as the US 2-year yield wavered around the 3.50% mark following a Federal Reserve (Fed) rate cut earlier this week that was ultimately perceived as not that hawkish after all. The cut is especially boosting the non-tech pockets of the market.

RECOMMENDED LESSONS

5 Forex News Events You Need To Know

In the fast moving world of currency markets where huge moves can seemingly come from nowhere, it is extremely important for new traders to learn about the various economic indicators and forex news events and releases that shape the markets. Indeed, quickly getting a handle on which data to look out for, what it means, and how to trade it can see new traders quickly become far more profitable and sets up the road to long term success.

Top 10 Chart Patterns Every Trader Should Know

Chart patterns are one of the most effective trading tools for a trader. They are pure price-action, and form on the basis of underlying buying and selling pressure. Chart patterns have a proven track-record, and traders use them to identify continuation or reversal signals, to open positions and identify price targets.

7 Ways to Avoid Forex Scams

The forex industry is recently seeing more and more scams. Here are 7 ways to avoid losing your money in such scams: Forex scams are becoming frequent. Michael Greenberg reports on luxurious expenses, including a submarine bought from the money taken from forex traders. Here’s another report of a forex fraud. So, how can we avoid falling in such forex scams?

What Are the 10 Fatal Mistakes Traders Make

Trading is exciting. Trading is hard. Trading is extremely hard. Some say that it takes more than 10,000 hours to master. Others believe that trading is the way to quick riches. They might be both wrong. What is important to know that no matter how experienced you are, mistakes will be part of the trading process.

Strategy

Money Management

Psychology

Best Brokers of 2025