Finding a good entry, stop and target is fundamentally the most important aspect of trading and investing in any market, not just Forex. I have found over my years of teaching that when I introduce students to our core strategy, they rarely ever want to use any of the other tools along with it because price will tell you all you need to know, if you learn to read it objectively. It will provide you with the clearest picture of the market and allow you to set stop losses, targets and entries without emotion and with controlled discipline. If you can learn to listen to what a price chart is really telling you rather than getting yourself caught up in unprofitable guesswork, you are, without doubt, on the right path to consistency in your trade plan. Learning to listen to price over your gut feelings is always the smartest approach to take.
It is for this reason that the Online Trading Academy curriculum focuses on our patented core strategy above all else. We look objectively at the price chart to recognize opportunities where imbalances are present between supply and demand. When these imbalances are present, we call this a supply or demand level. More importantly still, is that these levels are typically created by the most profitable banks and institutions so it makes good sense to the look at the market through their eyes and look to buy and sell when they do. The levels give us our entries and risk management parameters of the trades available.
First, we teach students about supply and demand zones, above all else we show them how to define the entry and what picture we specifically look for on the chart, as well as to identify their stop and target exits. As is often the case though, with traders and those who are learning to trade the markets, sometimes they get so caught up in finding an entry that they neglect the exit. Think about this for a second: what is the point of getting into a trade if you have no idea how to get out of it for profit? The stop loss takes care of itself, but the profit target can sometimes be the most challenging aspect of all, which is ironic considering that we are all trading to make money in the first place. When you ask yourself, “Where do I put my profit target?” the answer, as always, is on the price chart itself. The supply and demand levels illuminate your trades and they also help in discovering your targets.
Let’s take a look at a recent example:

This is a weekly time frame of the EURJPY currency pair. You can see in this example, that we have highlighted a lower area of demand in the price region of around 114.80. This area is attractive to us because there was a large imbalance between the willing buyers and the willing sellers which resulted in a strong move away in price to the upside. Clearly, the big money was trying to buy a lot of Euros at this price.
After seeing this on the chart, I want to be first in the line to buy if the price comes back to that area in the future. I would like to take an entry at the top section of the demand zone and use the lower section as a guide for placing my stop loss in case I am wrong on this buying opportunity. At this point I know where I want to buy and I know where I want to be out if I’m wrong. The only question left unanswered is, what will be my profit target?
Give it some more time and we will know more:
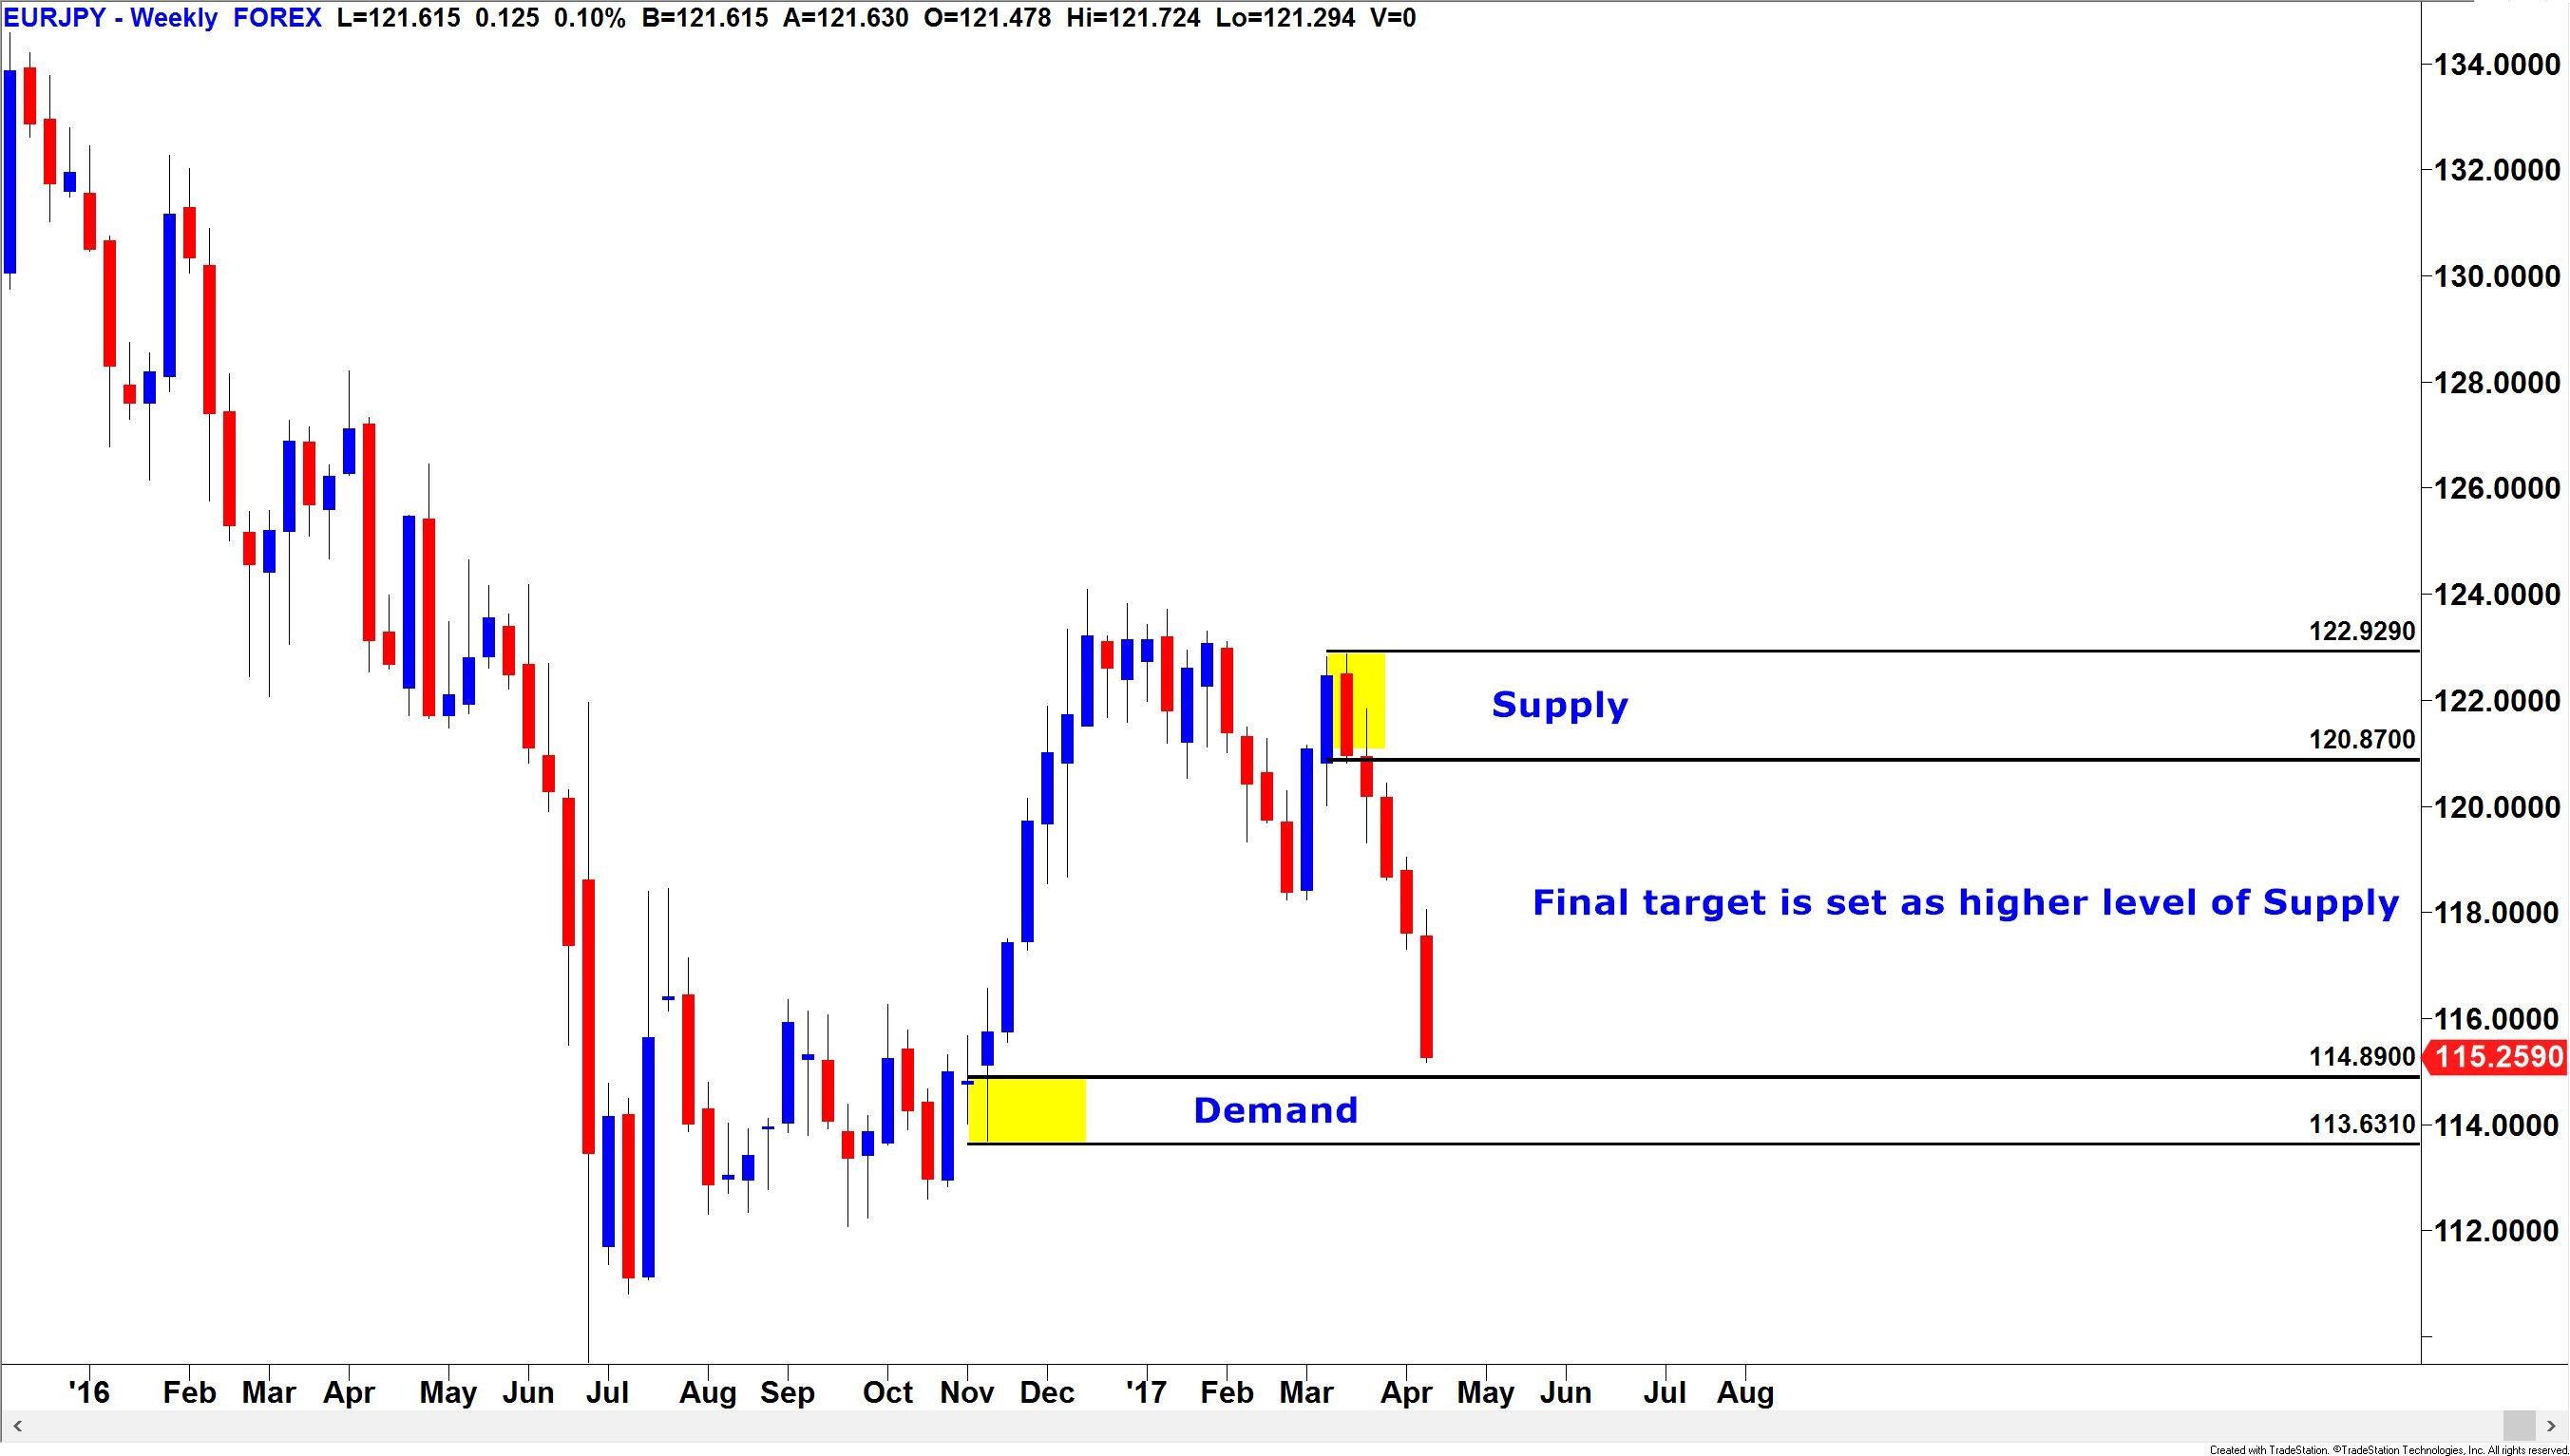
One of the disciplines that a swing trader needs to get used to is having patience. It can often be difficult to wait for a trade to come to you. As you get nearer to the entry, the question is where are you going to get out for profit? Well, let the chart tell you. Notice how there was a very impulsive and strong move to the down side from an area of supply around 120.85? When this drop happened, there were no more pockets of willing sellers left along the way, suggesting that the price should not have too much difficulty eventually getting all the way back up there, assuming the area of demand holds. This trade now offers a very attractive reward to risk ratio profile.
To some, this may look like an ambitious profit target. However, to OTA students this is a concept known as the path of least resistance. Some people refer to price as having a memory, and this is that dynamic in play. If the price chart is not telling you that there are any obstacles along the way to stop the market moving in your direction, then simply trust this objectively and trade the market how you find it. The supply zone above highlights where the selling pressure really is. Sure, there is no guarantee that the market will get there, but if you’re working on solid risk to reward ratios during your trade setups then not every single trade has to reach its final target. I always say, “The winners will take care of themselves as will the losers, but only if you use a protective stop order.” You can also have multiple targets and trailing stops if the trade works, to a degree.
Let’s see how things panned out:
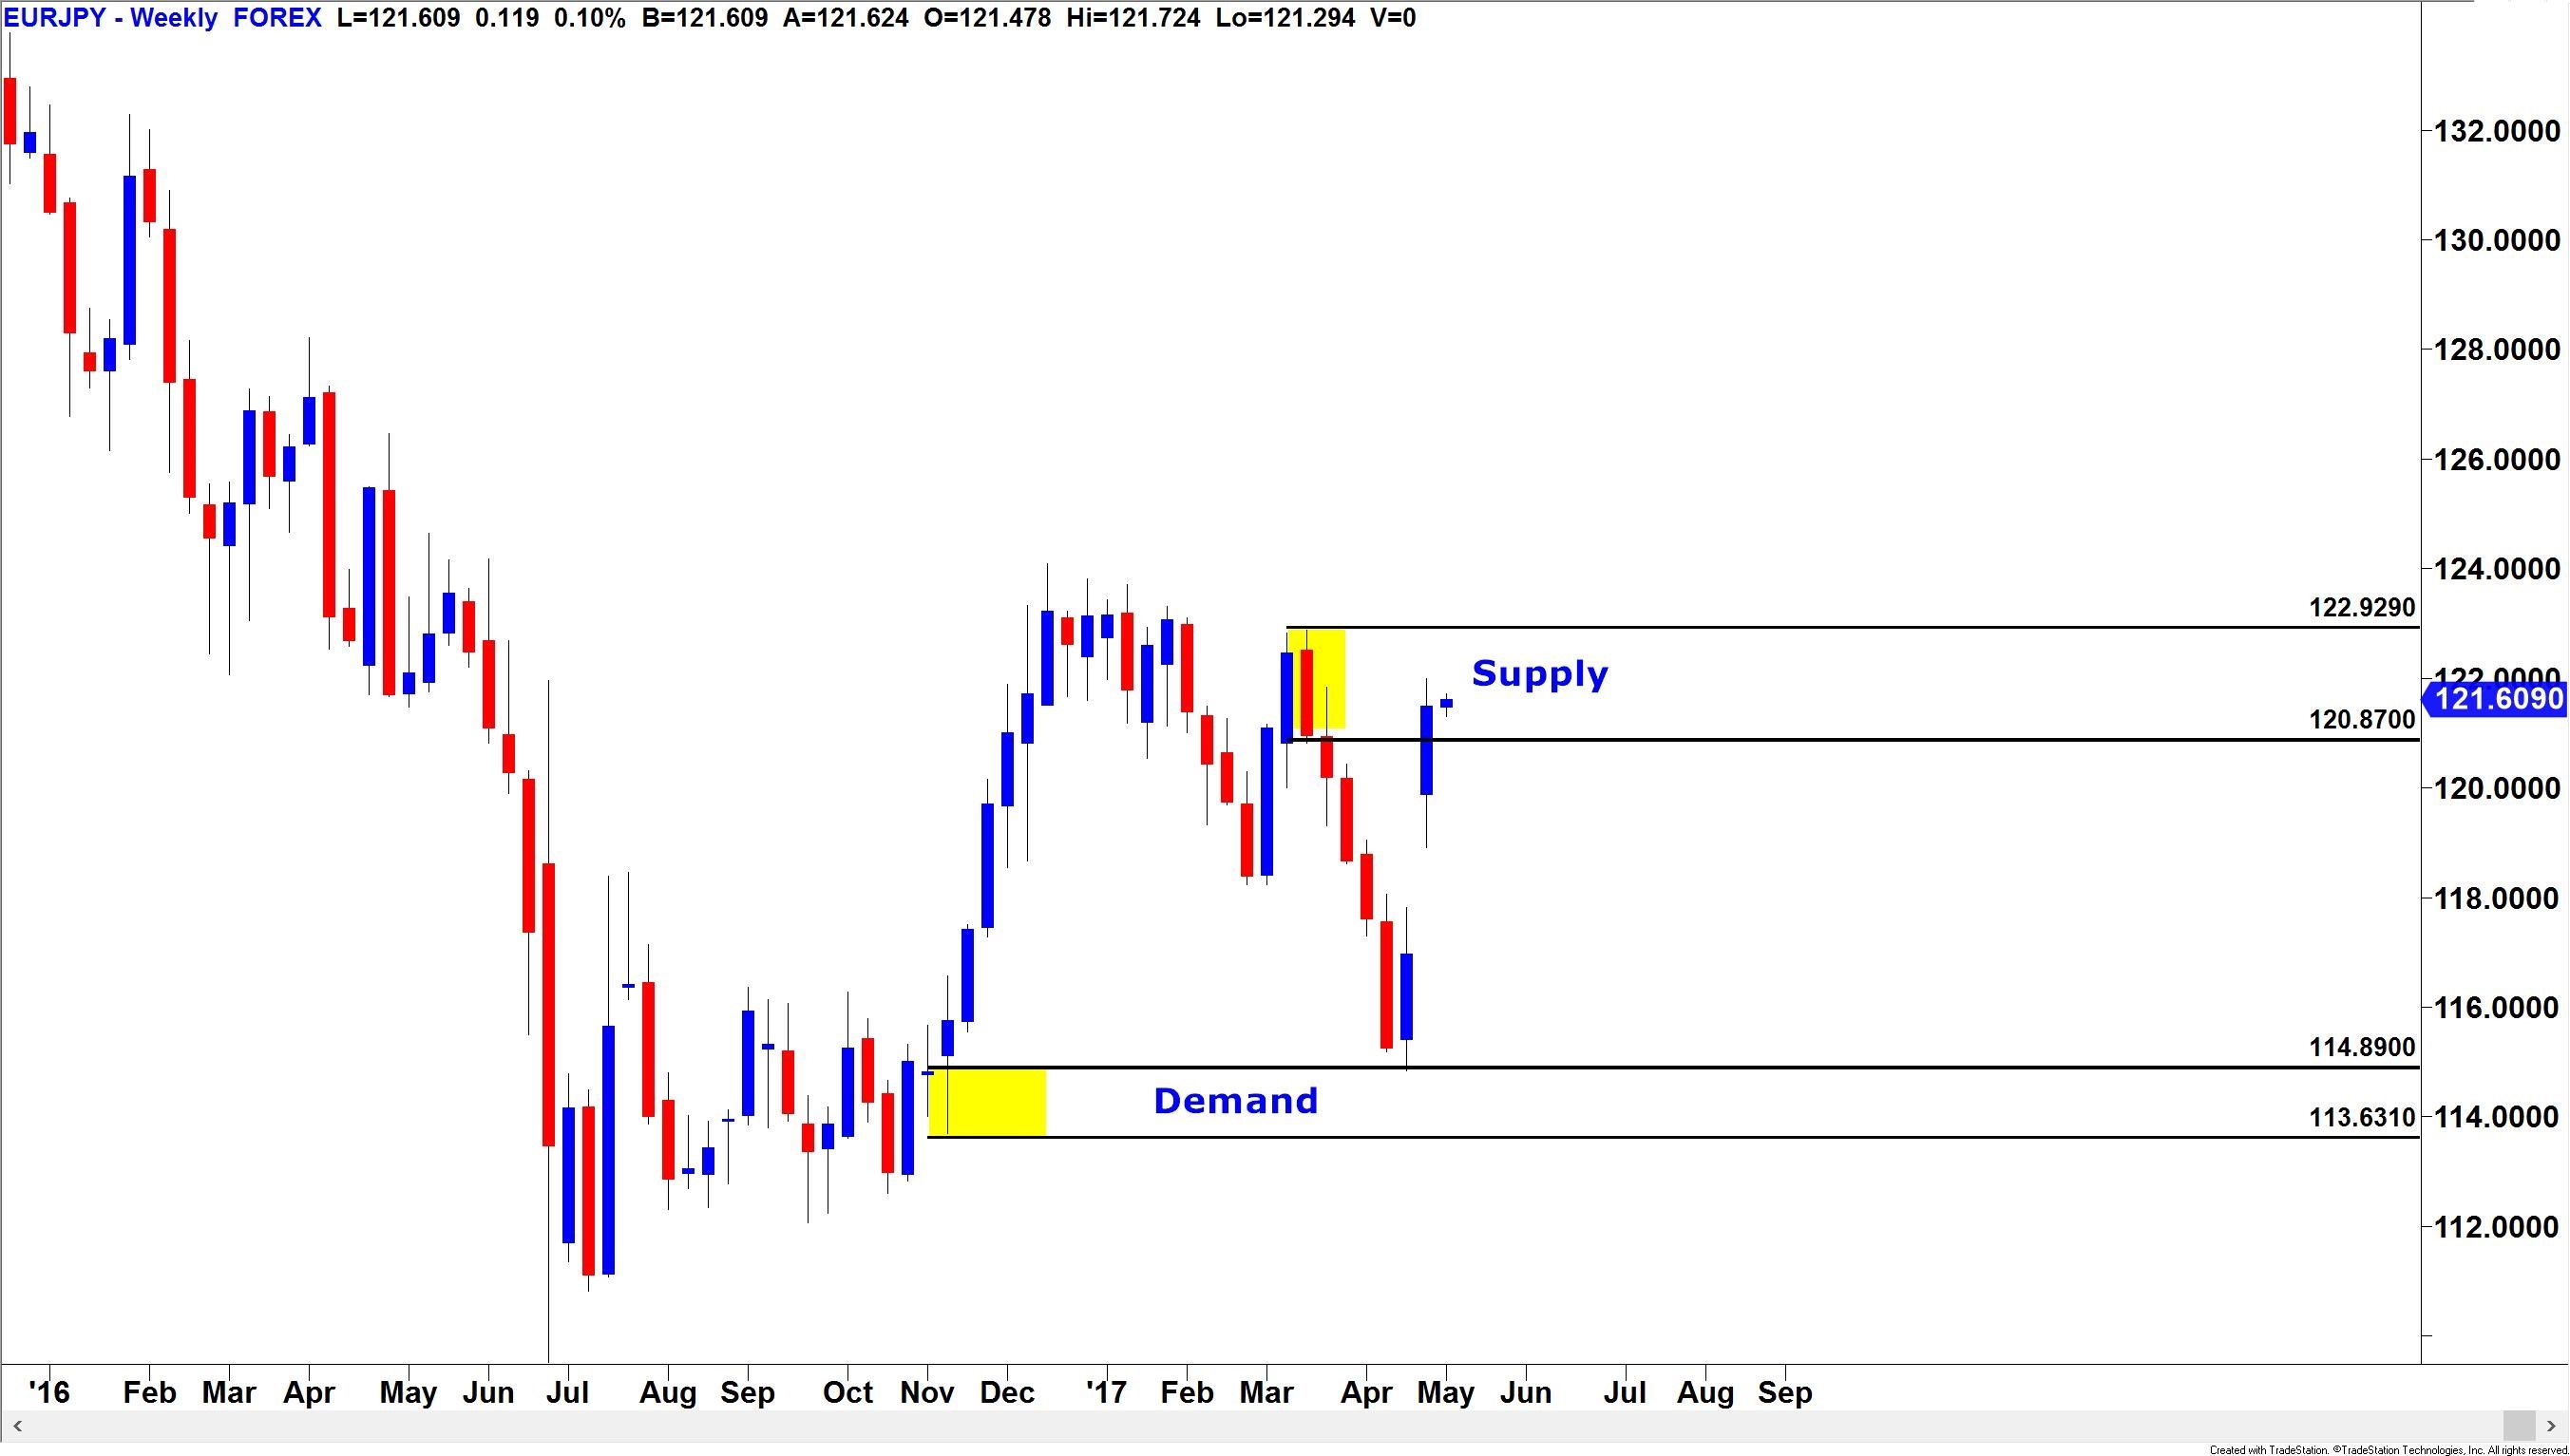
In this final chart snapshot, we can see that as quickly as price fell towards our entry, it pretty much rallied all the way back up to where it came from in the same length of time. As I said before, our core strategy not only tells us when to get in and when to get out for a small loss, but it also tells us when to get out for a profit, but only if we learn to trust the levels we are analyzing.
The more that you learn to set your trades, step away from the charts and allow the market to do its thing, without actually being there to watch it, the more likely you are to have success at trading.
I can put my own hand up and say that I’ve been my greatest enemy in my trading career over the years by taking profits too soon as opposed to trusting the levels which the market is showing me. Build your plan, do your analysis and let the market tell you what to do. That’s the key ingredient to consistency. I hope you found this useful.
The information provided is for informational purposes only. It does not constitute any form of advice or recommendation to buy or sell any securities or adopt any investment strategy mentioned. It is intended only to provide observations and views of the author(s) or hosts at the time of writing or presenting, both of which are subject to change at any time without prior notice. The information provided does not have regard to specific investment objectives, financial situation, or specific needs of any specific person who may read it. Investors should determine for themselves whether a particular service or product is suitable for their investment needs or should seek such professional advice for their particular situation. Please see our website for more information: https://bustamanteco.com/privacy-policy/
Editors’ Picks

EUR/USD climbs to daily highs near 1.1820
EUR/USD now picks up pace and advances to the area of daily peaks north of the 1.1800 barrier at the end of the week. The pair’s decent move higher comes against the backdrop of a generalised lack of direction in the FX galaxy and the mild offered stance in the US Dollar.

GBP/USD trims losses, retests 1.3460
After briefly challenging its key 200-day SMA near 1.3440, GBP/USD now manages to regain some balance and revisit the 1.3460 zone on Friday. Cable’s pullback comes as the selling pressure on the Greenback gathers traction, reigniting some recovery in the risk-linked space.

Japanese Yen gives back half of early gains against USD ahead of US PPI data
The Japanese Yen (JPY) surrenders half of its early gains against the US Dollar (USD) during the European trading session on Friday. The USD/JPY pair rebounds to near 155.90 as the JPY falls back, but is still 0.15% down.
Editors’ Picks

EUR/USD: Fed calm, ECB steady, but the Dollar still leads Premium
EUR/USD is still struggling to find real traction. The pair has tried to stabilise, but momentum keeps fading, leaving the door open to further weakness.

Gold: Falling US yields, geopolitics help XAU/USD hold ground Premium
Gold (XAU/USD) gained traction and climbed above $5,200, ending the fourth consecutive week in positive territory. The next round of US-Iran talks and crucial macroeconomic data releases from the US will be watched closely by market participants in the short term.
GBP/USD: Will Pound Sterling defend key 1.3450 support ahead of US jobs data? Premium
The Pound Sterling (GBP) entered a bearish consolidation phase against the US Dollar (USD), after having tested critical support near the 1.3450 level on several occasions.

Bitcoin: Another month of losses, and it’s been five
Bitcoin (BTC) price is stabilizing around $68,000 at the time of writing on Friday, but the Crypto King is poised to close February on a fragile footing, marking its fifth consecutive month of losses since October and a rare start to the year with back-to-back monthly corrections.

US Dollar: At a crossroads; Fed steady, tariffs in flux Premium
The US Dollar’s (USD) upward momentum from the previous week seems to have encountered a tough nut to crack in the 98.00 region, as measured by the US Dollar Index (DXY).
RECOMMENDED LESSONS
Making money in forex is easy if you know how the bankers trade!
I’m often mystified in my educational forex articles why so many traders struggle to make consistent money out of forex trading. The answer has more to do with what they don’t know than what they do know. After working in investment banks for 20 years many of which were as a Chief trader its second knowledge how to extract cash out of the market.
5 Forex News Events You Need To Know
In the fast moving world of currency markets where huge moves can seemingly come from nowhere, it is extremely important for new traders to learn about the various economic indicators and forex news events and releases that shape the markets. Indeed, quickly getting a handle on which data to look out for, what it means, and how to trade it can see new traders quickly become far more profitable and sets up the road to long term success.
Top 10 Chart Patterns Every Trader Should Know
Chart patterns are one of the most effective trading tools for a trader. They are pure price-action, and form on the basis of underlying buying and selling pressure. Chart patterns have a proven track-record, and traders use them to identify continuation or reversal signals, to open positions and identify price targets.
7 Ways to Avoid Forex Scams
The forex industry is recently seeing more and more scams. Here are 7 ways to avoid losing your money in such scams: Forex scams are becoming frequent. Michael Greenberg reports on luxurious expenses, including a submarine bought from the money taken from forex traders. Here’s another report of a forex fraud. So, how can we avoid falling in such forex scams?
What Are the 10 Fatal Mistakes Traders Make
Trading is exciting. Trading is hard. Trading is extremely hard. Some say that it takes more than 10,000 hours to master. Others believe that trading is the way to quick riches. They might be both wrong. What is important to know that no matter how experienced you are, mistakes will be part of the trading process.
The challenge: Timing the market and trader psychology
Successful trading often comes down to timing – entering and exiting trades at the right moments. Yet timing the market is notoriously difficult, largely because human psychology can derail even the best plans. Two powerful emotions in particular – fear and greed – tend to drive trading decisions off course.