W.D. Gann's master forecasting methods

By Jeff Greenblatt
The best way to predict the future is to have an understanding of the past, noted master trader W.D. Gann who had more than 50 years of experience in financial markets and did research dating back hundreds of years. What he found to his satisfaction was that history repeats, and the past is the best predictor of future prices. His forecasts of time cycles over a half century proved to be accurate because those cycles are based on human nature, which does not change.
Gann was a complex individual. He sold his master course during the Great Depression for $5,000 — a small fortune in today’s dollars. People paid the price, but found a lot was left to interpretation, perhaps akin to Gann dropping a 1,000-piece jigsaw puzzle on your coffee table and leaving you to assemble it without a picture. Needless to say, today’s generation of traders would expect more out of an expensive trading course, so it’s understandable why so many find his work mysterious and confusing.
We can’t conquer Gann’s mysteries in one article, but we can put a few practical pieces of that puzzle together.
According to Gann himself, one of his most important and valuable discoveries was that price squares with time. This means that it’s possible to forecast important changes in a trend with greater accuracy because an equal number of price points balance an equal number of time periods. There are variations, though. We’ll look at some macro examples and then one that is applicable to everyday trading.
Crash matters
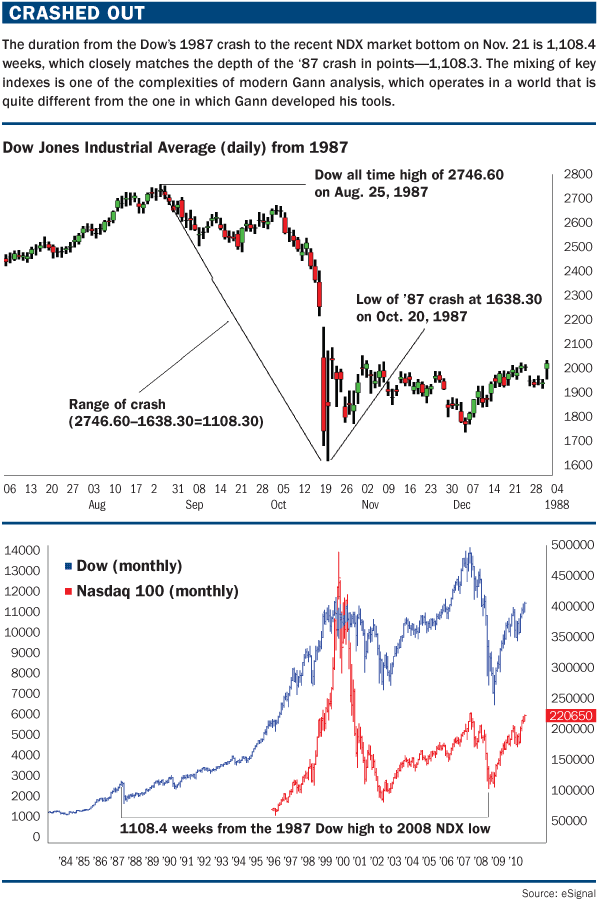
It is beyond doubt that the range from the 1987 sequence has squared time to the point where the market traced out one of its bear market bottoms on Nov. 21, 2008. With all the bearish sentiment the past couple of years, each sell-off demonstrates how much the cyclical importance of the bear market bottom is misunderstood — as well as its ties to the cycle top of a generation earlier.
The 1987 high was recognized as an important top for the entire decade, until it was taken out in 1989 on the recovery that led to the bull market of the 1990s. The 1,108 number also appears to be critical because 1108.49 is also the low for the Nasdaq Composite in the bear market in 2002.
The 2008 Nasdaq 100 low is not just some random pivot, but a point in history tied into long-term market cycles. It should be put into context with current investment and trading decisions. Every market sell-off will not lead to new bear market lows. However, given that low is so important, it would take a powerful leg to violate and invalidate it.
The next example is of a smaller degree but no less significant. The S&P 500 bear market had a range of 1576.09 to 666.79 for 909.30 points, which topped on Oct. 11, 2007. If we take the number of calendar days from Oct. 11, 2007 to the April 26, 2010 high we get 928 days, so apparently it doesn’t work.
However, the market is never easy and it makes you dig as it attempts to conceal its true hand. When we take the Nasdaq top from Oct. 31, 2007 to April 26, 2010, we get 908 calendar days, which puts us off by one. (A margin of error of plus or minus one is acceptable.) The relationship marked an important trading leg down.
Much of Gann’s material is a mystery to modern day traders. One reason is that not all of Gann’s principles are clear. Perhaps the master wanted his students to do their own due diligence. There are several variations to this concept. The range will square over a long period of time. In the case of the Dow and Nasdaq 100, time squared with the range from the extreme high back in 1987 to a market bottom. In other instances, the trader might have to calculate from the extreme low. It also is possible a range such as 1,108 could have squared from either the top or bottom and terminated to create the top. It’s important to be open to all of the possibilities.
Granted, this can be confusing, and Gann never envisioned his methods to be used in a fast-paced Internet world. Given that, it is no doubt more challenging for modern traders to exploit these techniques.
21st century Gann
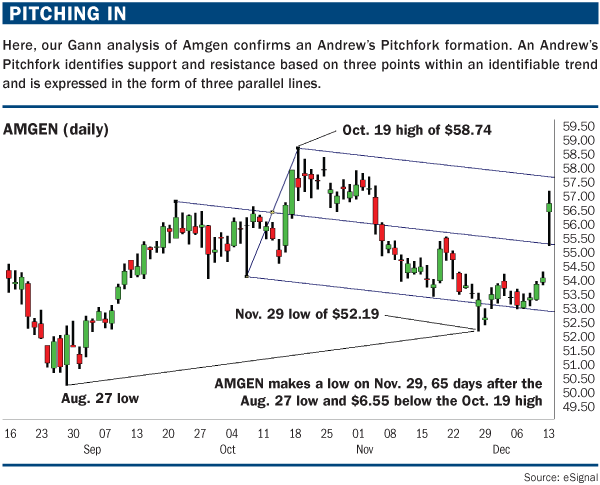
Amgen had a low on that August turn and found another low 65 trading days later (see "Pitching in"). With a high on Oct. 19 at 58.74 and a low at 52.19, there was a range of 6.55. In a world with a five-digit Dow, four-digit SPX and either two to four digits to the right of the decimal on futures or forex, traders must adapt.
In the case of 7700/77 or 65/6.55, the meaning is the same. This can be used as a standalone technique or in combination with another tool. As we have seen, it would be hard to combine a long-term range calculation with any other method. However, shorter-term trading is about developing conviction about a move and the more evidence the trader can stack, the greater the probability he or she will get to the point of allowing a winner to run.
For example, the Amgen move is combined with an Andrew’s pitchfork. This particular pattern reversed right on the lower pitchfork line to give the trader more confidence in the overall technical condition. There was good evidence to take the initial trade, but with early congestion, it may have challenged the trader’s faith. Eventually, this move gapped through the midline right to the upper channel, making it a good swing trade.
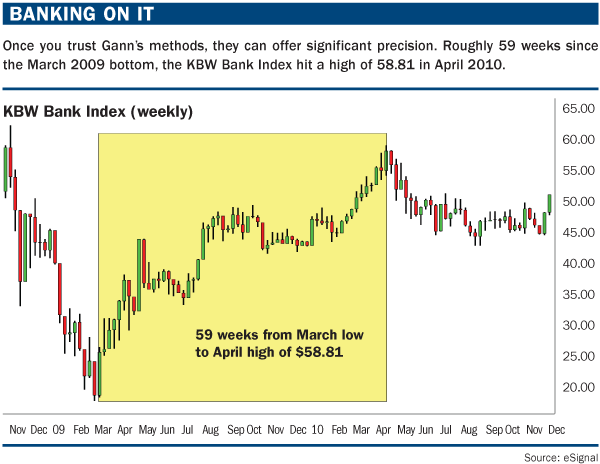
Another variation is where time and price square in the same place. A great example of this was the April top in the KBW Bank Index (see "Banking on it"). The high since the March 2009 bottom came in at price point 58.81 in roughly 59 weeks. (From March 6, 2009 to April 21, 2010 it is exactly 58.71 weeks.) This method gives the trader a high degree of timing precision. If a square relationship can be identified on a key sector or important market leader, it can be a huge edge because the trader can leverage this information into many kinds of trading opportunities.
Gann’s techniques are so new to most of us that it is necessary to have an open mind as we approach them. For those practicing these methods for the first time, it will require practice and patience to learn to trust the pattern. Gann called the squaring the range with time method his most important discovery, and it is still as valuable today as it was in his era.
Author

Futures Magazine Contributors
FuturesMag.com
For 40 years, traders have trusted Futures for education, trading advice and product and service information.


