The top three never-revealed secrets of the Gann's great wheat trade of 1909 and how to profit from it

If you are struggling to understand how the Wheat trade worked or looking for a practical solution to make money from Gann’s trading secrets, this could be the most important message you have ever read.
I am willing to put my money on the line to prove my trading system works. I am the founder of Gann Explained and my mission is to share the W.D.Gann trading method in a simple and duplicatable way.
And now I am going to share the insider scoop on how I cracked the code. And I can prove it with my brokerage statements (which you can find on my website).
Astrology is of paramount importance to Gann’s impressive predictions as can be found in his list of recommended readings. However, if we wish to emulate Gann’s outstanding forecasting skills, we must follow in his footsteps and trading principles.
Gann’s principles
Gann’s forecasting theories consisted of two components:
1. Cycle of Time. Gann conducted exhaustive research on the Cause and Effects of cycles on financial markets, and here’s one of his famous quotes and findings: ‘When Time runs out, Change is Inevitable.’
2. The Gann Emblem. The square and triangle inside a circle give the 360, 120, and 90-degree angles/aspects between the planets. When the planets are 90° apart, forming a square, and 120° apart, forming a trine, different amounts of energy are stored inside each aspect/angle. And if you translate this into a trading chart, the energy is stored inside the candle. And as Gann put it in the famous Ticker Interview:
“This steel will run up to 58, but it will not sell at 59. From there, it should break 16 points.” We sold it short, around 58, with a stop at 59. The highest it went was 58. From there, it declined to 41-17 points.”
Gann could predict the 1/8 of the price due to his ability to calculate the remaining stored energy for the stock.
Implications
The principles of astrology are similar to wireless communication. Angles/Aspects formed between planets give electromagnetic pulse to the Earth and affect the mass without our knowing. You don’t see the signals, but you know the cycles are working.
In addition to astrology, Gann discovered the natural law that governs the rate of vibration of an uptrend or downtrend. According to Gann, ‘Every top or bottom in wheat or other commodities comes out by an exact mathematical proportion (the interlocking squares and triangles) to some other top or bottom.’
In summary, Gann’s trading principles are based on correctly identifying the beginning and end of the underlying cycles driving a financial asset and then measuring the price movement inside the cycle.
The price and time secrets
Gann's forecasts of the stock and commodity markets were based on his secret "time factor," which he described:
"Many people want to know what method I use to determine future indications on the market. I keep charts of the various active stocks and also a set of averages. My charts are different from the charts of the average statistician because they are based on my discovery. I have discovered a "time" factor that enables me to determine important tops and bottoms one year or more in advance. My annual forecasts on stocks, issued in December for ten years past, have proved remarkably correct. The cotton and grain markets can also be forecast by this "time" factor, which enables me to tell when extreme highs and lows will be made, as well as the minor moves" ("Truth Of The Stock Tape", 1923, page 41 of the appendix).”
Time & Price is not one entity; we need to SEPARATE them into two equations.
Secret #1: Price is reflected in the remaining energy stored in the candle
It works like Physics. Think of the metal balls swinging pendulum; it shows the law about conservation of Momentum and Energy. The energy runs through the balls, affecting how far the metal balls fly. The same applies to the energy stored in the price of the candles. The power of each candle is ruled by the amount of momentum energy remaining in it. The stored energy will be released to the market, causing a rally, plunge, or sideways movement. There is a mathematical approach to calculating the momentum and energy remaining in the candle that governs the movement of a stock, commodity, cryptocurrency, or index, and that’s the core of our Trading Genius Formula.
Secret #2: Time is independent of price momentum
Time is governed by astrological timing. Let me give you an example. Every 90 degrees movement of the earth to the sun is three months and means a change of season. With this information, we can foreknow the temperature on Earth, whether it will become colder or warmer every three months. In older days, people used Solar calendars to mark the seasons, weather, and farming/ fishing activities. In the ancient Chinese calendar, we have a solar term called the “little winter” (5th or 6th of January), a day when the sun moves through 15 degrees Capricorn. It is often the coldest day in the year or within +/- 15 days.
My point is that astrological timing is always associated with ONE exact time. And you can allow a window of 30 minutes or less for our trading signal to act on the market.
The wheat trade decoded
Step #1: Calculate the end of the cycle timing
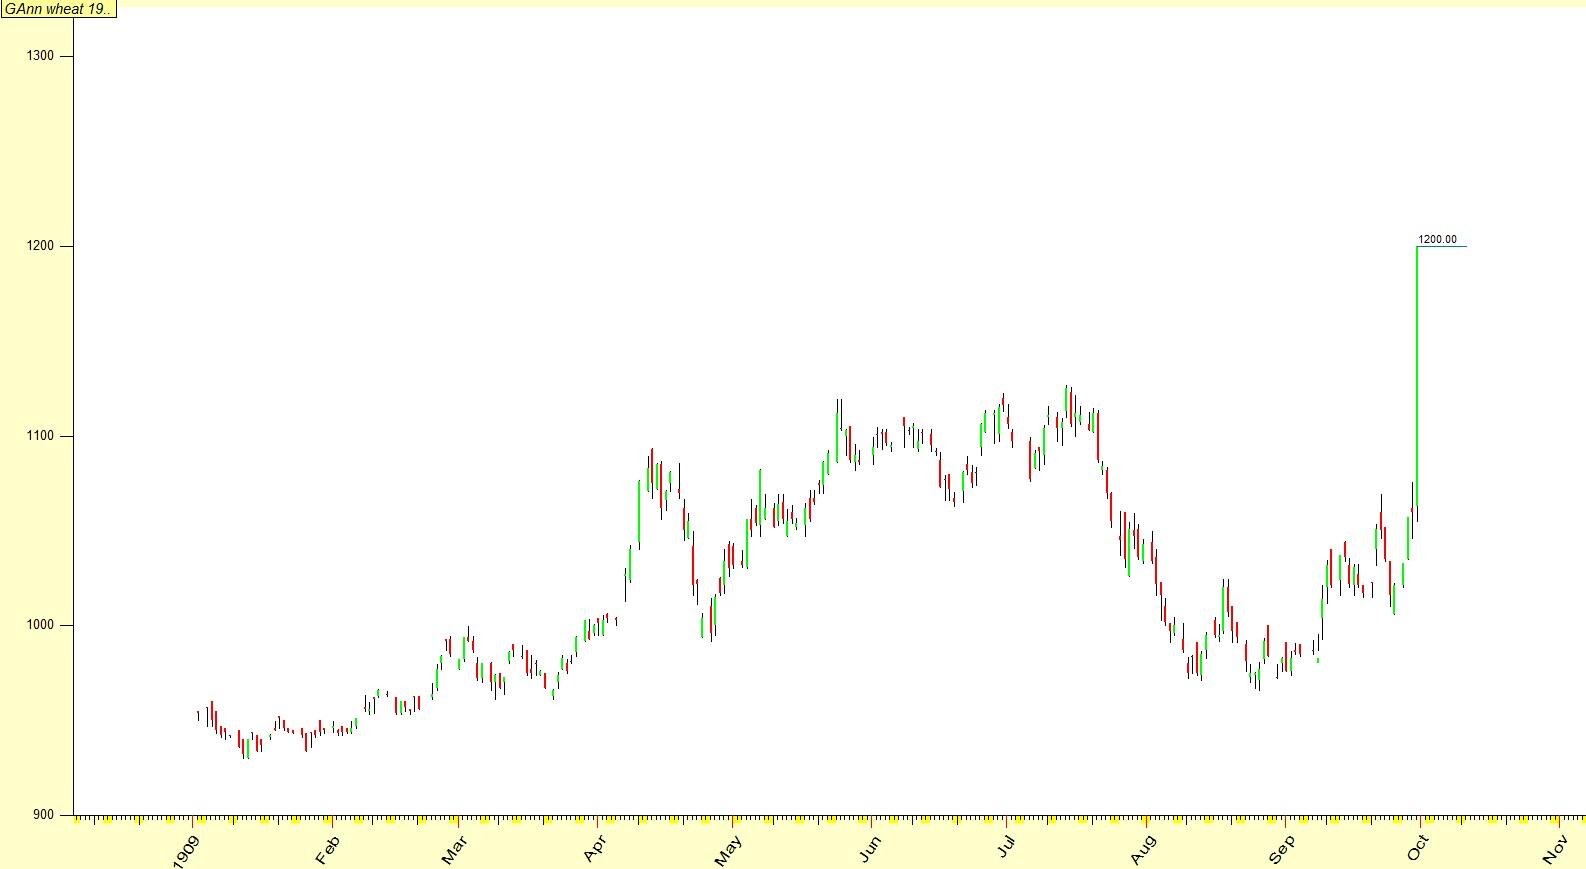
Gann had figured out the end of the cycle time, September 30th, 1909, well in advance.
At noon Chicago time, on September 30th (the last day), the option was selling below $1.08, and foreknowing the end of cycle time, Gann said:
‘If it does not touch $1.20 by the close of the market, it will prove that there is something wrong with my whole method of calculation. I do not care what the price is now; it must go there.’
Step #2: Calculate the energy stored inside the candle
Back in 1909, wheat's average daily range was only 1 cent, and the Sept Wheat contract had never traded above $1.12 and 7/8 in the entire life of the trading contract. And at noon on Sept 30, 1909, the very last day of trading, with only an hour and 20 minutes to go, September wheat was trading at $1.07; in less than an hour and 15 mins after noon, Wheat had moved all the way upwards to trade at WD Gann’s predicted price of $1.20, resulting in one big candle before closing.
When you see a giant candle, it indicates a lot of energy is trapped but has no avenue (for example, news) to release. The market had to release all the remaining power in 20 minutes to match its time target of September 30th, 4 pm.
The wheat trade was an astonishing calculation; however, besides the endpoint he mentioned on the 30th of September, 1909, he had no idea what the wheat price would be on the 27th, 28th, or 29th. My point is that WD Gann could not predict price movement every single second in the market.
IMPORTANT: The market does not have a specific price to abide by at every single second, but only at a critical time, the cycle beginning or end.
This also explains why there are always failed breakouts in the market because the eventual price is higher than the maximum energy confined in the price movement. In Trading Genius Formula, we share the Gann-inspired mathematical formula that uncovers the calculation of the total energy release that causes the momentum in the market and the change of trend.
Practical problems & solutions
No traders had matched Gann’s remarkable predictions and trading record. The sad truth is that 99% of people who study his courses fail to decode the secrets.
My mission is to create a Gann Movement so more traders can benefit from the lost art.
We’ve put together a “Trade Like W.D. Gann” Challenge that will allow you to experience combining Astro and Mathematical trading - just like the famous Gann’s wheat trade. On top of that, I want to give you an Exciting Gift - the Golden Harmonic Number that provides Entry points and works on all timeframes and markets. It is truly a revolutionary method for calculating price by combining multiple cyclical laws.
Author

Khit Wong
Gann Explained
As a noted expert on FXStreet.com and in “Technical Analysis of Stocks & Commodities” and "Traders World," I specialize in applying W.D. Gann's complex theories to practical trading.


