![]() Gabe Velázquez
Gabe Velázquez
Online Trading Academy
One axiom that has stuck with me through the years is the one used when traders are on a losing streak and they refer to engaging the market as “picking daisies in a minefield”. This saying refers to the notion that when the market looks very good: in an uptrend, great news being released, and every pundit telling you they’re bullish, this is usually when it blows up. Sound familiar?
This is not limited to going long; shorts also find huge reversals to the upside just when the market looks as though it’s ready to fall off the abyss. We see this time and again as the markets are full of traps that the unsuspecting novice trader usually fall prey to.
One of these traps is the idea that when prices trade above or below prominent price points, the particular Futures contract is perceived to be bullish or bearish. These price points can be a variety of conventional technical levels. Some are what are commonly referred to as support or resistance. Others can be a prior day’s high or low (pivots). Also, the overnight peaks and troughs (known as the Globex) are seen in this fashion as well.
In the two charts below you can see what these traps look like.
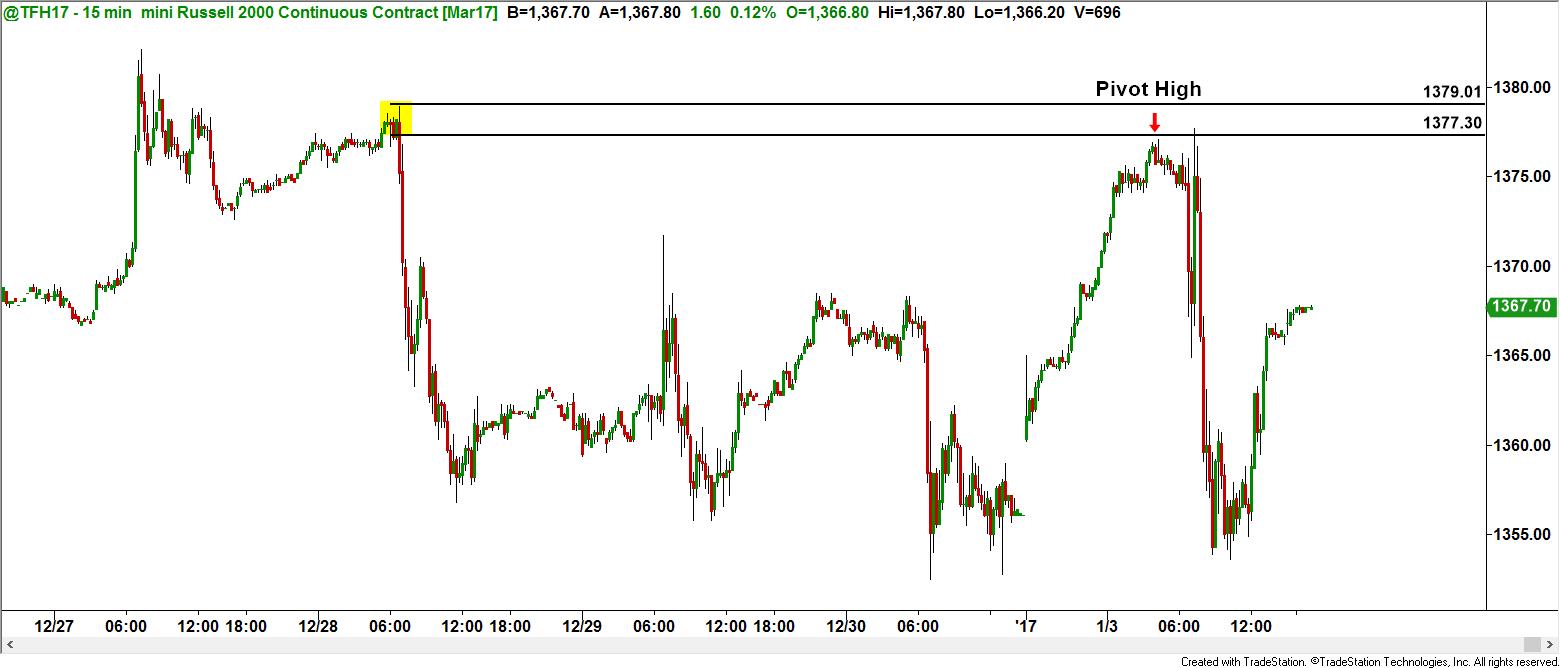
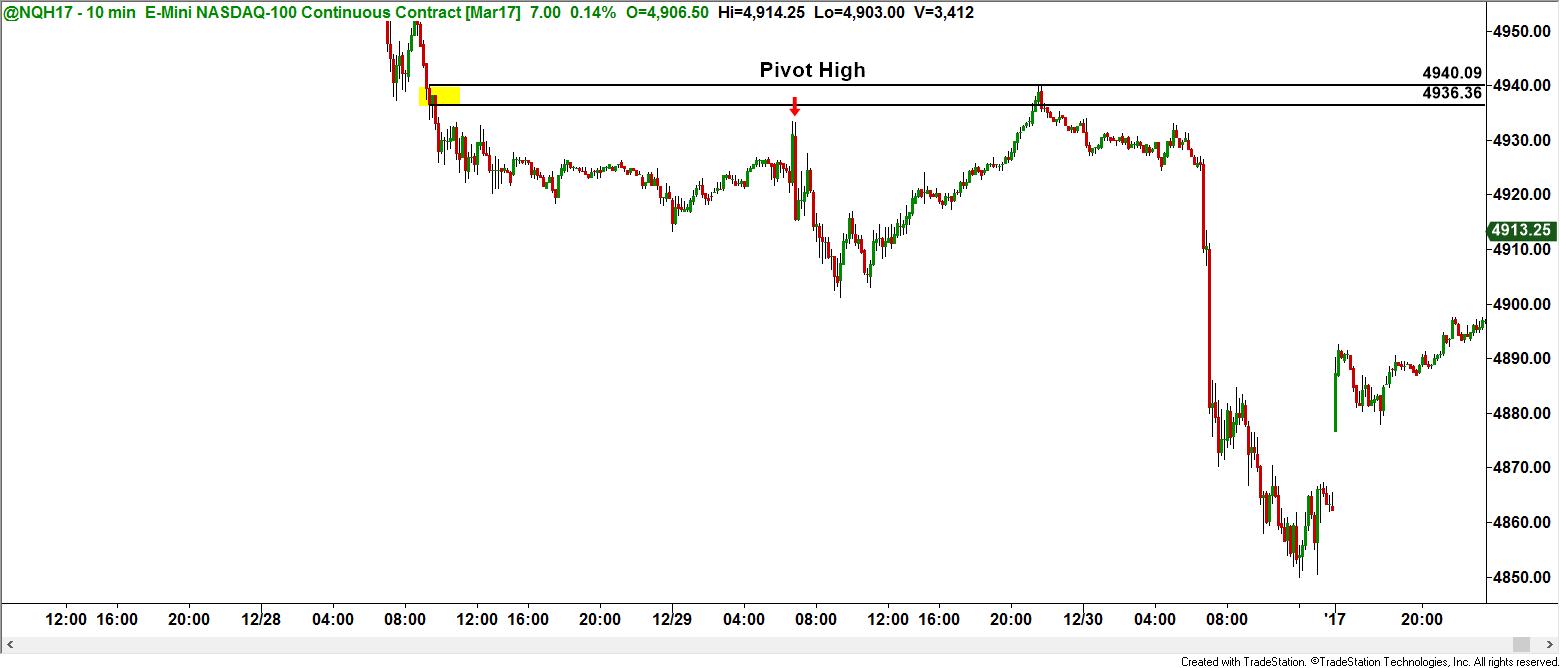
As we can see in the charts above there have been two of these type of setups in the equities futures. One in the TF (E-mini Russell 2000) and another in the Nasdaq E-mini. These worked very nicely as they both dropped substantially. Most traders would wonder why you would want to short new highs. If you think that, then the trap is set.
The main reason is that many traders are “conditioned” by all the books on conventional technical analysis to buy new highs or lows. As I mentioned earlier, this tends to make them bullish or bearish depending on where prices trade. There are many instances where the new highs actually act as pull back areas in a trade. In other words, a higher high in the context of an uptrend quite frequently acts as the high point before a retracement, thus stopping out those that chase the trend.
The next and most important point is that often times right above or below these new highs and lows are supply and demand levels which act as repellents to those new buyers or sellers. This is exactly what happened in the two examples shown above. If you look closely inside the smaller time frame candles you will discover those pockets of sell orders just waiting to get filled.
In addition, traders on Wall Street know pretty much where novice traders will buy, sell and place their stops. Do you think that would be hard to guess? Probably not. They essentially know the playbook of any trader that has read a book on technical analysis.
Since many of you have been reading these articles for a while, I suspect you probably don’t buy new highs or sell new lows in your own trading. For the rest of you, making sure you don’t fall prey to this particular trap means learning how to identify quality supply and demand levels, as well as learning that conventional thinking is a trap in itself.
Until next time, I hope everyone has a great week.
This content is intended to provide educational information only. This information should not be construed as individual or customized legal, tax, financial or investment services. As each individual's situation is unique, a qualified professional should be consulted before making legal, tax, financial and investment decisions. The educational information provided in this article does not comprise any course or a part of any course that may be used as an educational credit for any certification purpose and will not prepare any User to be accredited for any licenses in any industry and will not prepare any User to get a job. Reproduced by permission from OTAcademy.com click here for Terms of Use: https://www.otacademy.com/about/terms
Editors’ Picks

EUR/USD climbs to daily highs near 1.1820
EUR/USD now picks up pace and advances to the area of daily peaks north of the 1.1800 barrier at the end of the week. The pair’s decent move higher comes against the backdrop of a generalised lack of direction in the FX galaxy and the mild offered stance in the US Dollar.

GBP/USD trims losses, retests 1.3460
After briefly challenging its key 200-day SMA near 1.3440, GBP/USD now manages to regain some balance and revisit the 1.3460 zone on Friday. Cable’s pullback comes as the selling pressure on the Greenback gathers traction, reigniting some recovery in the risk-linked space.

Japanese Yen gives back half of early gains against USD ahead of US PPI data
The Japanese Yen (JPY) surrenders half of its early gains against the US Dollar (USD) during the European trading session on Friday. The USD/JPY pair rebounds to near 155.90 as the JPY falls back, but is still 0.15% down.
Editors’ Picks

EUR/USD: Fed calm, ECB steady, but the Dollar still leads Premium
EUR/USD is still struggling to find real traction. The pair has tried to stabilise, but momentum keeps fading, leaving the door open to further weakness.

Gold: Falling US yields, geopolitics help XAU/USD hold ground Premium
Gold (XAU/USD) gained traction and climbed above $5,200, ending the fourth consecutive week in positive territory. The next round of US-Iran talks and crucial macroeconomic data releases from the US will be watched closely by market participants in the short term.
GBP/USD: Will Pound Sterling defend key 1.3450 support ahead of US jobs data? Premium
The Pound Sterling (GBP) entered a bearish consolidation phase against the US Dollar (USD), after having tested critical support near the 1.3450 level on several occasions.

Bitcoin: Another month of losses, and it’s been five
Bitcoin (BTC) price is stabilizing around $68,000 at the time of writing on Friday, but the Crypto King is poised to close February on a fragile footing, marking its fifth consecutive month of losses since October and a rare start to the year with back-to-back monthly corrections.

US Dollar: At a crossroads; Fed steady, tariffs in flux Premium
The US Dollar’s (USD) upward momentum from the previous week seems to have encountered a tough nut to crack in the 98.00 region, as measured by the US Dollar Index (DXY).
RECOMMENDED LESSONS
Making money in forex is easy if you know how the bankers trade!
I’m often mystified in my educational forex articles why so many traders struggle to make consistent money out of forex trading. The answer has more to do with what they don’t know than what they do know. After working in investment banks for 20 years many of which were as a Chief trader its second knowledge how to extract cash out of the market.
5 Forex News Events You Need To Know
In the fast moving world of currency markets where huge moves can seemingly come from nowhere, it is extremely important for new traders to learn about the various economic indicators and forex news events and releases that shape the markets. Indeed, quickly getting a handle on which data to look out for, what it means, and how to trade it can see new traders quickly become far more profitable and sets up the road to long term success.
Top 10 Chart Patterns Every Trader Should Know
Chart patterns are one of the most effective trading tools for a trader. They are pure price-action, and form on the basis of underlying buying and selling pressure. Chart patterns have a proven track-record, and traders use them to identify continuation or reversal signals, to open positions and identify price targets.
7 Ways to Avoid Forex Scams
The forex industry is recently seeing more and more scams. Here are 7 ways to avoid losing your money in such scams: Forex scams are becoming frequent. Michael Greenberg reports on luxurious expenses, including a submarine bought from the money taken from forex traders. Here’s another report of a forex fraud. So, how can we avoid falling in such forex scams?
What Are the 10 Fatal Mistakes Traders Make
Trading is exciting. Trading is hard. Trading is extremely hard. Some say that it takes more than 10,000 hours to master. Others believe that trading is the way to quick riches. They might be both wrong. What is important to know that no matter how experienced you are, mistakes will be part of the trading process.
The challenge: Timing the market and trader psychology
Successful trading often comes down to timing – entering and exiting trades at the right moments. Yet timing the market is notoriously difficult, largely because human psychology can derail even the best plans. Two powerful emotions in particular – fear and greed – tend to drive trading decisions off course.